IMAGE

Fig. 2

ID
ZDB-IMAGE-230814-100
Source
Figures for Méhes et al., 2023
Image
Figure Caption

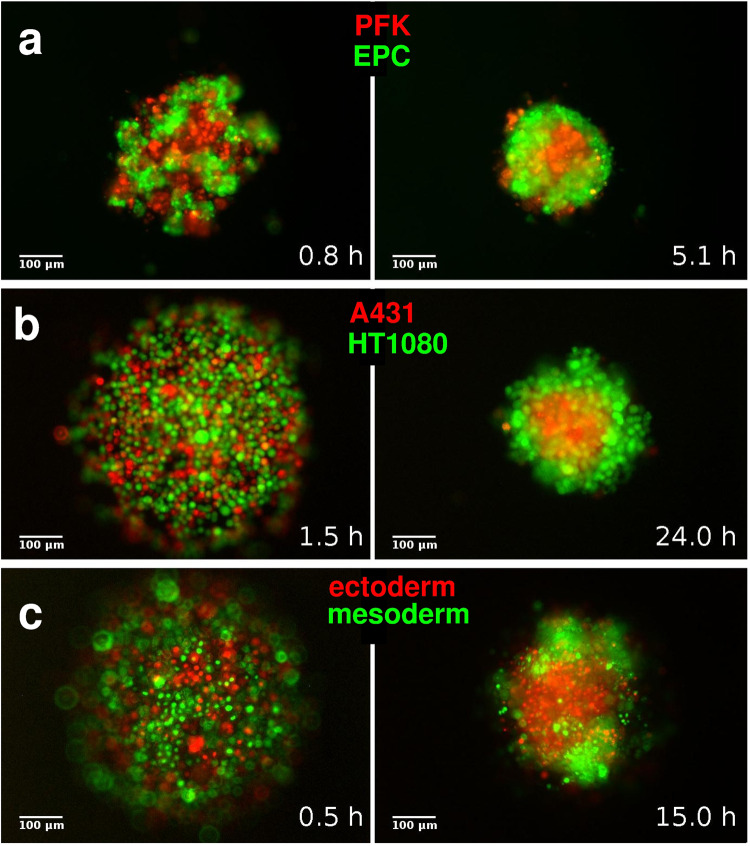
Fig. 2 3D segregation of model cell types.

Representative epifluorescent images from image series of segregation experiments. a Segregation of primary goldfish keratinocytes (PFK, red) and EPC fish keratinocytes (EPC, green). b 3D segregation of human A431 epithelial carcinoma (A431, red) and human HT1080 fibrosarcoma (HT1080, green) cells. c Segregation of zebrafish ectoderm (red) and mesoderm (green) cells. Left panels in (ac) show the initial phase of segregation, and the right panels show the final spatial configuration of segregated homotypic domains. Time after the initial mixing of heterotypic cell suspensions is indicated at lower right corners, scale bars: 100 µm. Also, see Supplementary Movies 35.

Acknowledgments
This image is the copyrighted work of the attributed author or publisher, and ZFIN has permission only to display this image to its users. Additional permissions should be obtained from the applicable author or publisher of the image. Full text @ Commun Biol