
|
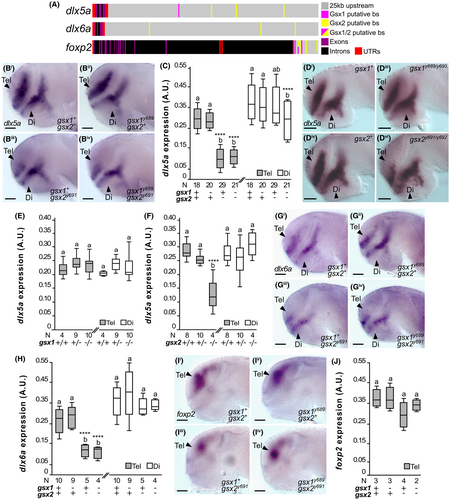
Fig. 9 Regulation of dlx5a, dlx6a, and foxp2 by Gsx1 and Gsx2. (A) Schematic of Gsx1 and 2 putative binding sites (putative bs) upstream of the zebrafish dlx5a, dlx6a, and foxp2 gene bodies. (Bi-Biv) dlx5a expression at 30 hpf in wild type, gsx1y689, gsx2y691, and gsx1y689;gsx2y691 zebrafish. Images are ×20 compound scope images with samples mounted under cover glass, eyes dissected, and anterior facing left. Scale bar = 50 μm. (C) Quantification of dlx5a expression from experiment shown in (B) panels. Sample sizes for all FIJI-ImageJ analyses are indicated. Different letters represent significant differences and asterisks correspond with P-values; *P < .05, **P < .01, ***P < .005, ****P < .001. (Di-Div) dlx5a expression at 30 hpf in wild type, gsx1y689/y690 mutants and gsx2y691/y692 mutants. (E). Quantification of dlx5a expression in gsx1y689/y690 mutants experiment in (D) panels. (F) FIJI-ImageJ quantification of dlx5a expression in gsx2y691/y692 mutants experiment shown in (D) panels. (G) dlx6a expression at 30 hpf in wild type, gsx1y689, gsx2y691, and gsx1y689;gsx2y691 zebrafish. (H) Quantification of dlx6a expression in (G) panels. (Ii-Iiv) foxp2 expression at 30 hpf in wild type, gsx1y689, gsx2y691, and gsx1y689;gsx2y691 zebrafish. (J) Quantification of foxp2 expression in (I) panels experiment