
|
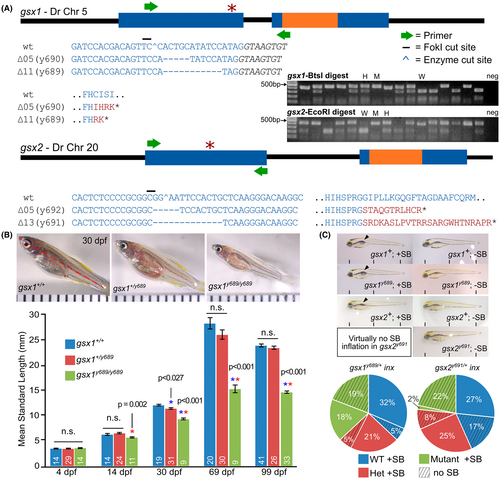
Fig. 7 gsx1 TALEN mutants experience stunted growth and gsx2 TALEN mutants experience swim bladder inflation failure. (A) Schematic of the gsx1 and gsx2 gene bodies and targeted TALEN mutation site (red *). All mutations should result in a premature stop codon. Text color corresponds with gene body structure (blue = exon, black = intron, orange = homeodomain, red = mutant sequence). Inset gel shows restriction digest of gsx1 and gsx2 amplicons in wild type (W), heterozygous (H), and mutant (M) individuals; endonuclease cutting is disrupted in mutants. (B) Comparison of the standard length (SL, red line) of gsx1+/+, gsx1+/y689, and gsx1y689/y689 siblings at 30 dpf. Images are dissecting scope images and distances between black tick marks represent 1 mm. Graph shows the quantification of long-term growth study data from 4 to 99 dpf. Asterisks indicate significant differences between that group and the genotype with the same color asterisk (blue bar, wild type; red bar, heterozygote; green bar, mutant). (C) Top, comparisons of gsx1+/+, gsx1+/y689, and gsx1y689/y689 siblings and gsx2+/+, gsx2+/y691, and gsx2y691/y691 siblings with (+SB) and without (−SB) swim bladders, respectively; bottom, quantification of the percentage of larvae of each genotype with and without swim bladders (gsx1 n = 73 siblings, gsx2 n = 60 siblings)