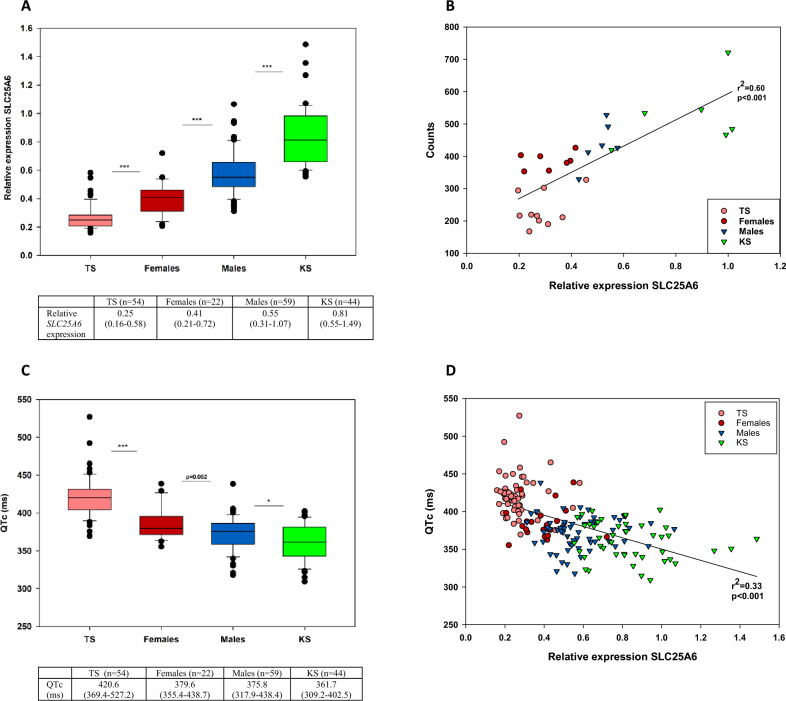
SLC25A6 expression levels in humans correlate with QTc interval duration. (A) Box plot and table showing relative expression levels of SLC25A6 determined by qPCR in patients with Turner syndrome, Klinefelter syndrome and female and male controls. Values in table are medians and range. n (TS) = 54, n(KS) = 44, n(females) = 22, n(males) = 59. (B) Correlations between absolute expression values of SLC25A6 (counts) and relative expression of SLC25A6 in the subpopulation. n(TS) = 10, n(KS) = 6, n(females) = 7, n(males) = 6). (C) Box plot and table of QTc in patients with Turner syndrome, Klinefelter syndrome and female and male controls. Values in the table are median and range. n(TS) = 54, n(KS) = 44, n(females) = 22, n(males) = 59. (D) Correlation between QTc and relative expression of SLC25A6. n(TS) = 54, n(KS) = 44, n(females) = 22, n(males) = 59). Corrected QT interval (QTc) was calculated using Bazett´s equation (QTc = QT × √1/RR). Statistical analysis were performed by Mann Whitney U-test (median with range).TS, Turner syndrome. KS, Klinefelter syndrome. *p < 0.05, ***p < 0.001.
Acknowledgments
This image is the copyrighted work of the attributed author or publisher, and
ZFIN has permission only to display this image to its users.
Additional permissions should be obtained from the applicable author or publisher of the image.
Full text @ Sci. Rep.
Your Input Welcome
Thank you for submitting comments. Your input has been emailed to ZFIN curators who may contact you if
additional information is required.
Oops. Something went wrong. Please try again later.