
|
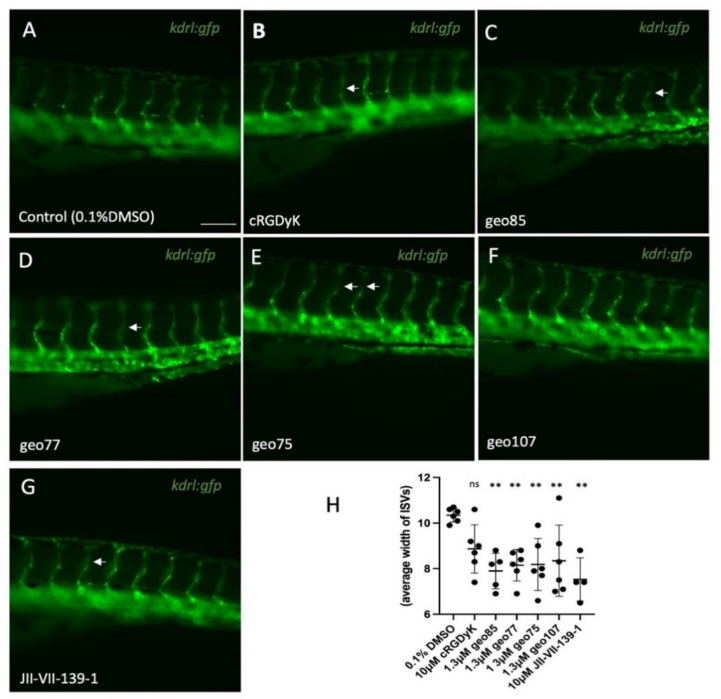
Fig. 9
In vivo screening unravels inhibitors of angiogenesis. (A–G) Fluorescence microscopy images of representative Tg(kdrl:gfp) embryos treated with the specified compounds from 24 hpf, and DMSO-treated control at 72 hpf. White arrows show sections of ISVs with decreased width. Scale bar, 100 μm. (H) Estimated and presented total width of 8 ISVs per embryo. Width was measured and averaged at three different points (top, middle and bottom point) of each ISV. Compounds JII-VII-139-1 (10 μM), geo75 (1.3 μM), geo77 (1.3 μM), geo85 (1.3 μM) and geo107 (1.3 μM), show statistically significant inhibition on the total width of ISVs, while compound c(RGDyK) (10 μM) shows a non-significant trend at the tested concentration. Data are expressed as mean ± SD (n = 4–7/group). ** p < 0.05.