
|
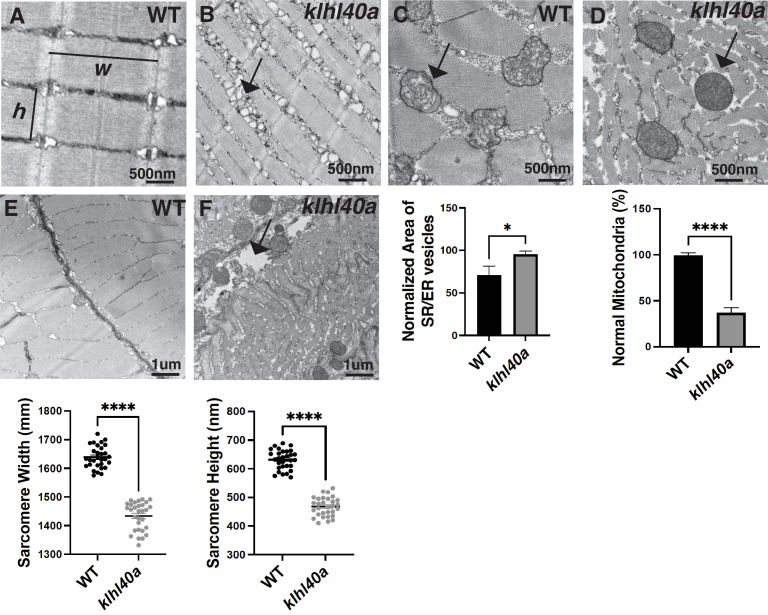
Figure 2 klhl40a allele displays reduced sarcomere size and abnormal membrane organelles in skeletal muscle. Transmission electron microscopy (TEM) showing the ultrastructure of control (+/+) and klhl40a KO in 3 months animals. (A–B) Longitudinal muscle section of control and klhl40a KO mutant muscle showing accumulation of membranous structures in SR-ER region (arrow) and reduced sarcomere width (w) and height (h). (C–D) Cross-section view showing mitochondrial in klhl40a KO mutant muscle contain electron-dense matrix (arrow) compared to control muscle (normal mitochondria). (E–F) The longitudinal view of skeletal muscle shows structural damage to the extracellular matrix (arrow) in the klhl40a KO mutant compared to the control. Electron microscopy was performed in three different control and klhl40a KO mutant fish. N=150–175 sarcomeres analyzed in each sample for quantification. N=75–100 mitochondria and 200–250 triads analyzed in each sample for quantification of the ER. Data are mean ± S.E.M; with one-way analysis of variance (ANOVA) and Tukey’s HSD test (****p<0.001).