
Figure 8—figure supplement 1.
- ID
- ZDB-IMAGE-230710-32
- Source
- Figures for Hasel de Carvalho et al., 2023
|
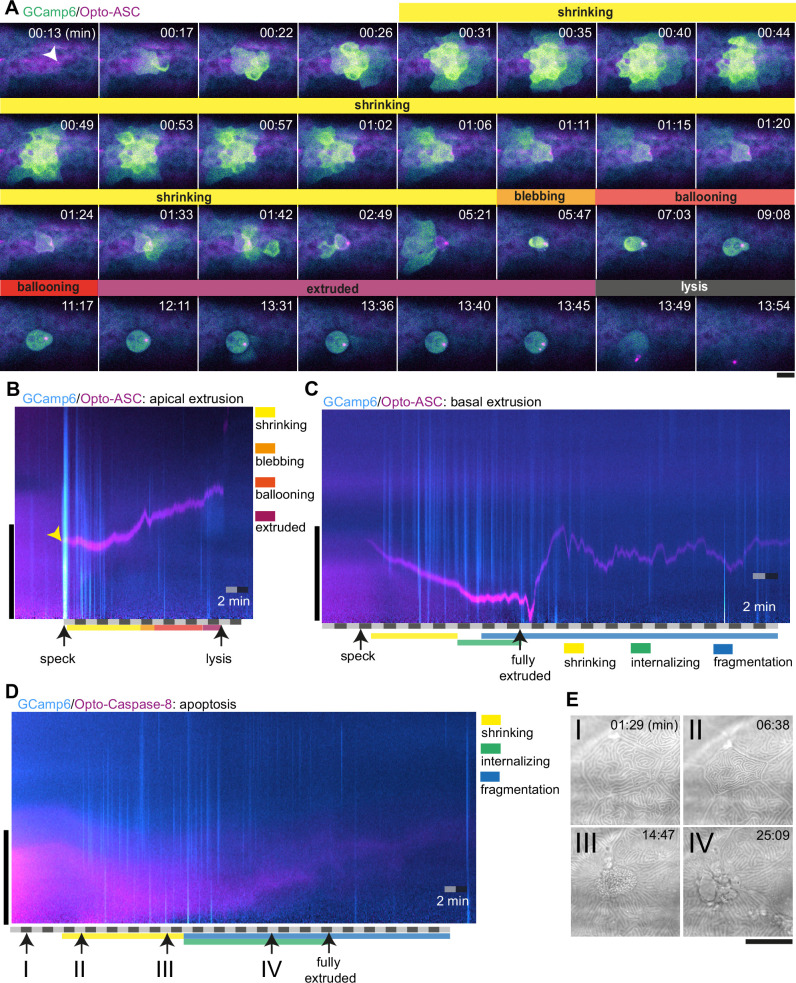
Figure 8—figure supplement 1. Ca2+ signaling in epithelial cells in response to dying cells. (A) Example of Ca2+ signaling in epithelial cells surrounding a cell forming an Opto-ASC speck (yellow arrow head) and being extruded from the tissue. Frames from a time-lapse image sequence of a larva expressing GCamp6 (light green) and Opto-ASC (magenta). Phases of the extrusion were characterized using the bright field channel, as described in Figure 5 and are color coded (yellow-black). Scale bar is 20 µm. (B–D) Two-dimensional representation in time and space (derived from 3D kymographs) of the Ca2+ response to cell death in the larval epidermis. The y-axis shows the radial space around the dying cell, as described in Figure 8—figure supplement 1. GCamp6 Ca2+ sensor signal intensity is shown in cyan and Opto-ASC in magenta. The scale bar on the y-axis is 20 µm. Time is marked along the x-axis in 2 min blocks. (B) Ca2+ signaling response to Opto-ASC-induced apical extrusion as shown in A. The phases of extrusion are color coded (yellow to dark red) as in panel A and Figure 5C. (C) Opto-ASC-induced cell death with basal extrusion. Phases of extrusion marked along the x-axis. (D) Opto-Caspase-8 (magenta)-induced apoptosis. Numbers on the x-axis refers to the images in E. (E) Bright field images of the cell analyzed in D illustrating stages of apoptotic cell death. I: Cell morphology before the first signs of cell death; II: isomorphic shrinkage of cell; III: microridge pattern has dissolved and cell starts to internalize; IV: cell has started to fragment. Scale bar in all images is 20 µm.