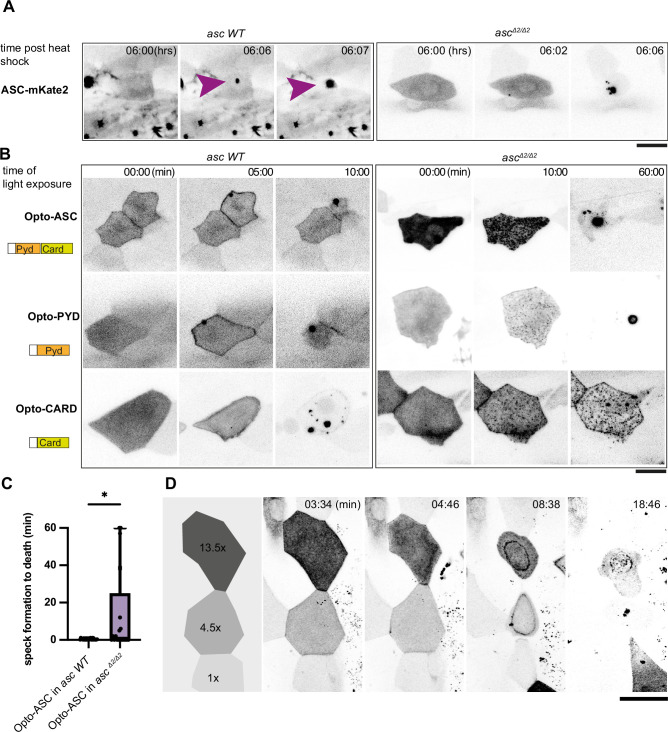
Figure 4.
Opto-ASC speck formation and dependence on endogenous ASC.
(A, B) Speck formation induced by ASC-mKate2, Opto-ASC, Opto-PYD and Opto-CARD in wildtype larvae and ascΔ2/Δ2 larvae. Scale bar is 20 µm. (A) Time for ASC-induced specks is counted from end of heat shock. Purple arrow heads mark the speck in the cell of interest. Specks formed by surrounding cells can be seen as black spots. (B) Time is in min counted from the last timepoint before visible speck formation. (C) Time is measured between first detectable appearance of a speck and first morphological sign of cell death (deformation of cell) in wildtype (N=23) and ascΔ2/Δ2 (N=14) larvae. *=p < 0.05. (D) Dynamics of speck formation in three cells with different expression levels of Opto-PYD. Relative intensity levels shown in the diagram on the left are measured in relation to the cell with the lowest level (1x) after background subtraction. Time is measured in minutes; scale bar is 20 µm.
Acknowledgments
This image is the copyrighted work of the attributed author or publisher, and
ZFIN has permission only to display this image to its users.
Additional permissions should be obtained from the applicable author or publisher of the image.
Full text @ Elife
Your Input Welcome
Thank you for submitting comments. Your input has been emailed to ZFIN curators who may contact you if
additional information is required.
Oops. Something went wrong. Please try again later.