Figure Caption
Figure 1.
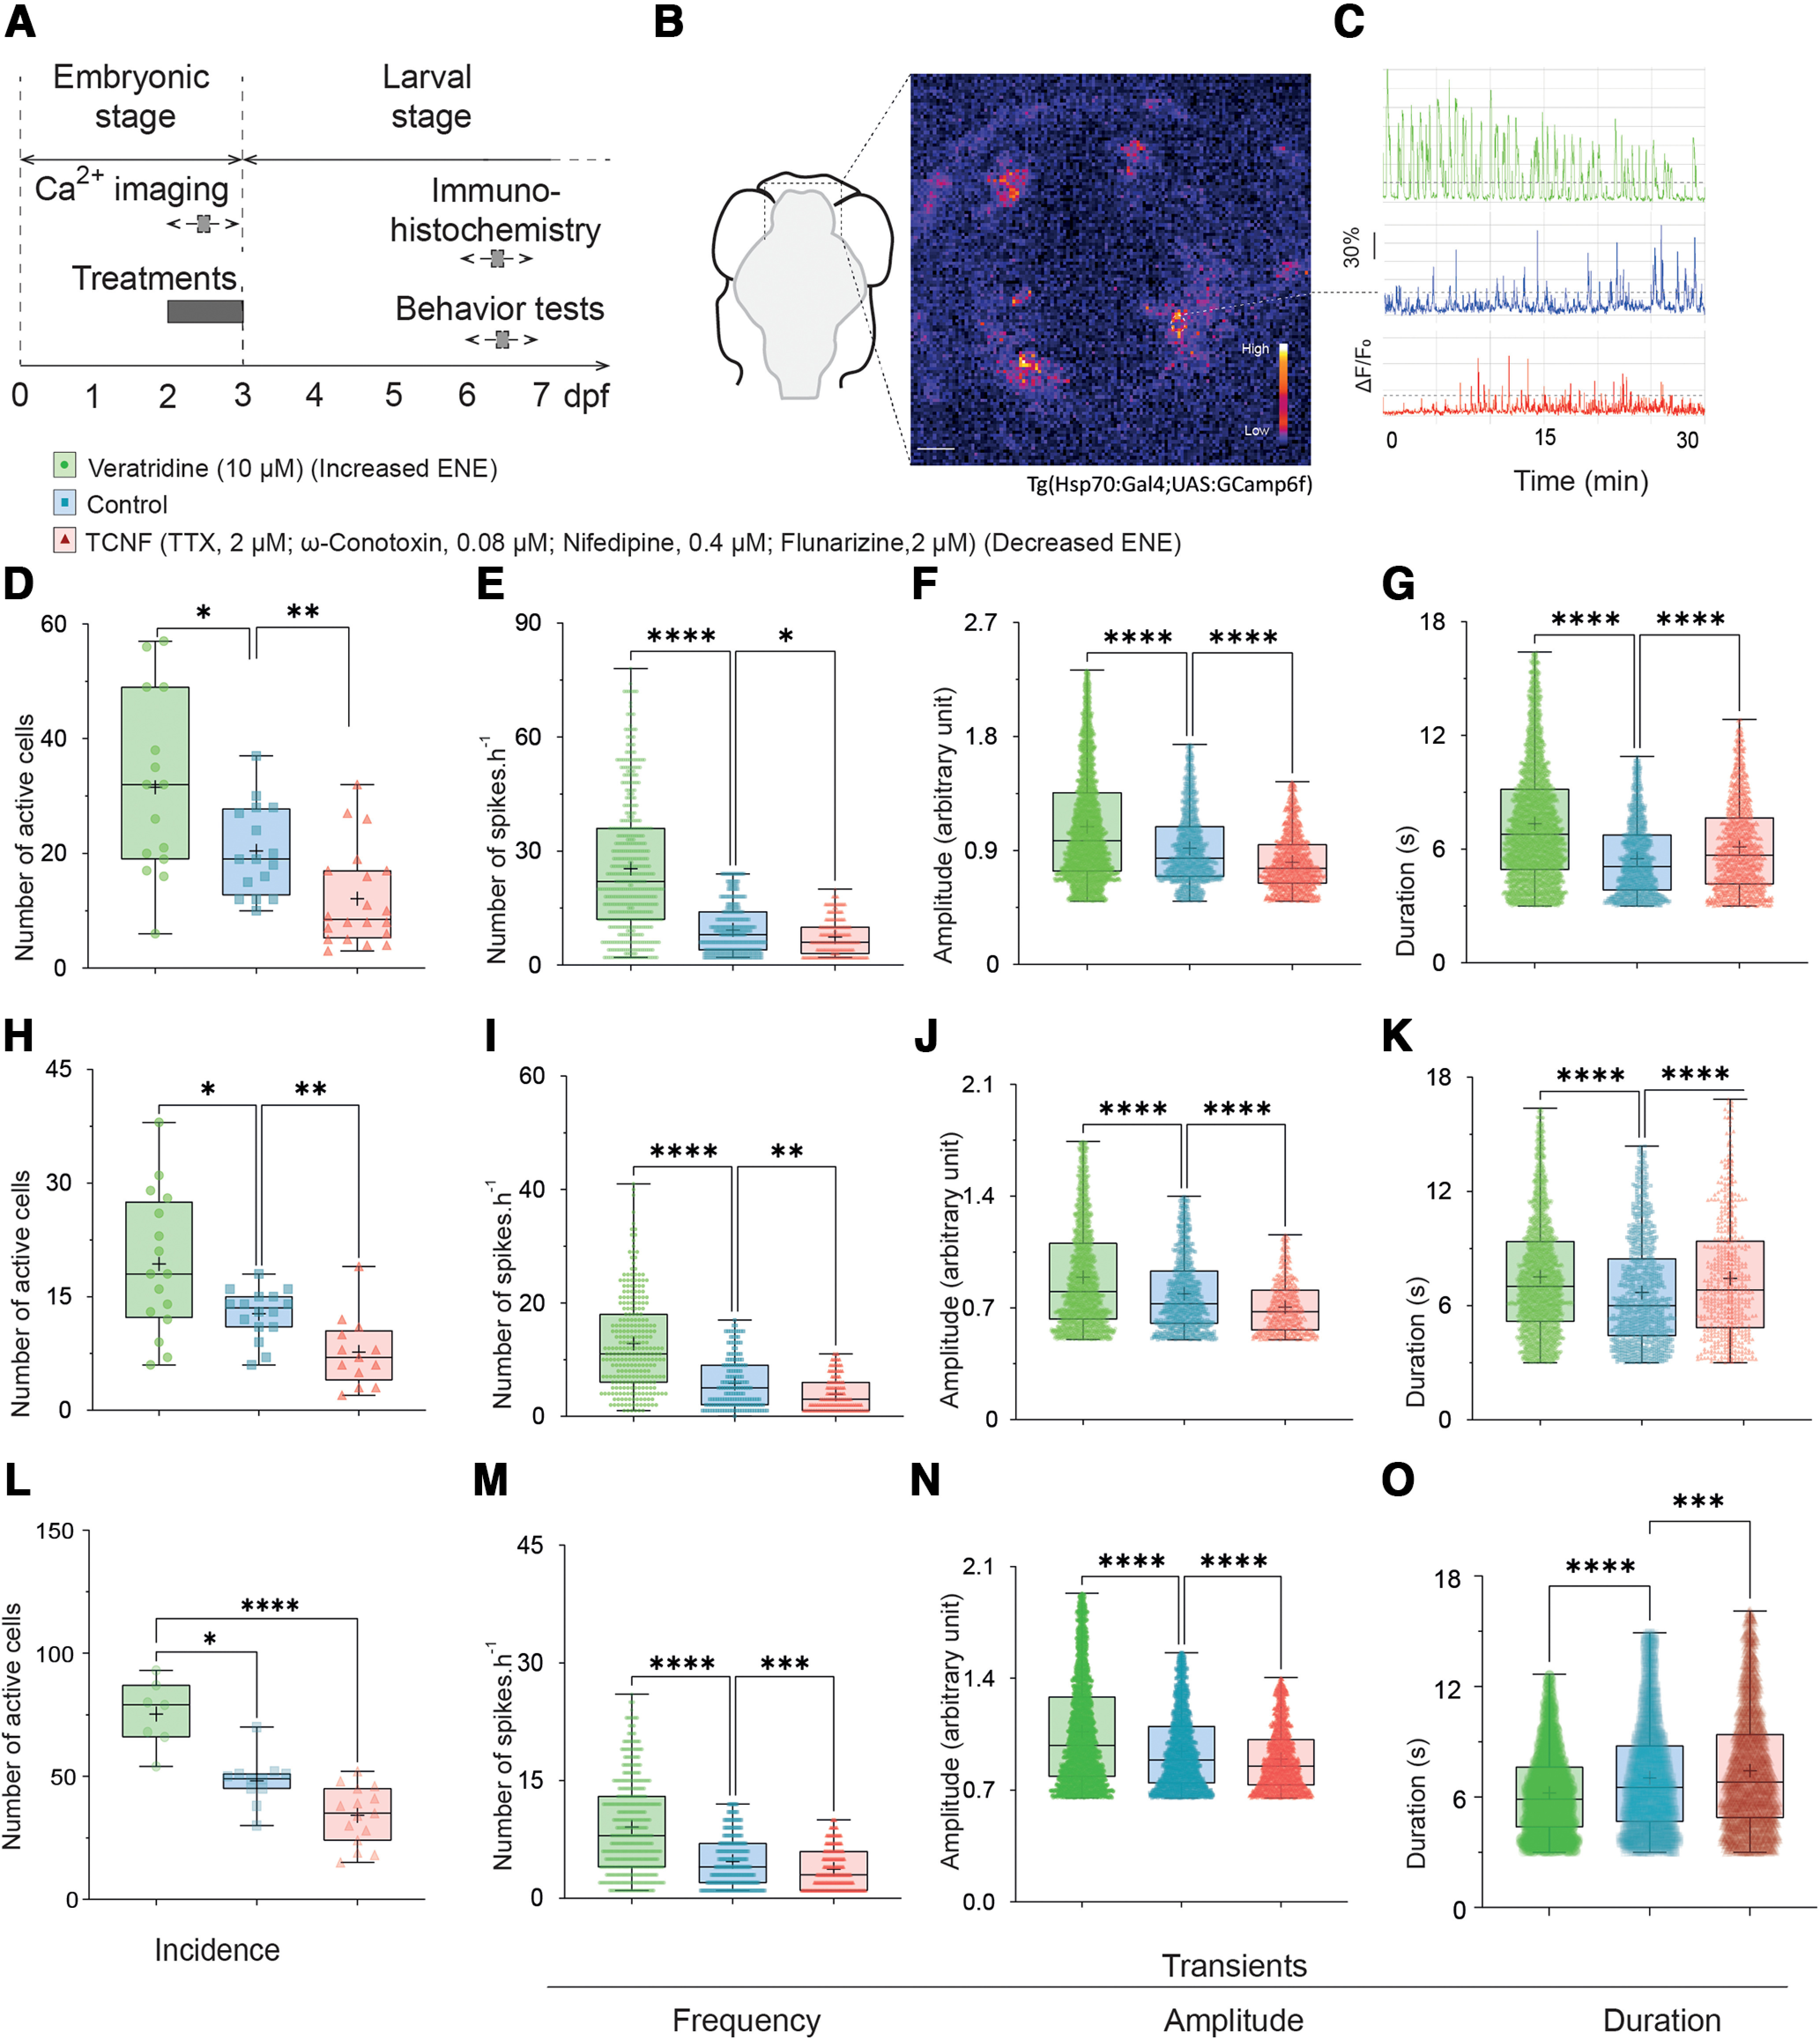
Timing of the experiments, characterization of forebrain calcium transients and their modification by bath application of pharmacological treatments. A, Timeline of the experiments. Pharmacological treatments and calcium imaging experiments were performed from 2 to 3 dpf (embryonic period) and the immunohistochemistry and behavior experiments were performed several days later, at 6–7 dpf (larval period). B, Left panel, Schematic ventral view of a zebrafish brain, showing the approximate region for calcium recordings. Right panel, Confocal image from a time-lapse recording of the brain of 48 hpf of Et(hsp:gal4;UAS:GCamp6f) embryos in control conditions. Fluorescence is displayed on a pseudocolor scale, the lookup table coding for the intensity scale is shown in the bottom-right corner of the image. Scale bar = 100 μm. White dash-circle defines an example region of interest corresponding to the cell body of a cell which changes in fluorescence are displayed in C. C, Representative changes in fluorescence intensity plotted as a function of time in different experimental conditions: control conditions in blue, following veratridine treatment (10 μm) in green, and following TCNF treatment (TTX, 2.5 μm; ω-conotoxin, 0.1 μm; nifedipine, 0.5 μm and flunarizine, 2.5 μm) in red. Ca2+ transients were scored as changes in fluorescence more than two times higher than the SD of the baseline (dashed lines), and >3 s in duration, calculated as the width at half-maximum. D–O, Boxplots showing different parameters of calcium spikes in control conditions (blue), following 10 μm veratridine treatment (green) and following TCNF treatment (red). D–G, Results obtained in the Hsp:gal4 line from five independent experiments. H–K, Results obtained in the TBP:gal4 line, from six independent experiments. L–O, Results obtained in the HuC:gal4 line, from three independent experiments. D, Average incidence of the recorded Ca2+ transients, BFW ANOVA, 15 < n < 21 fields of view. E, Average frequency, KW test, 291 < n < 535 values. F, Average normalized amplitude of the recorded Ca2+ transients, KW test, 1258 < n < 4809 transients. G, Average duration of the Ca2+ transients, KW test, 1258 < n < 4809 transients. H, Average incidence of the recorded Ca2+ transients, BFW ANOVA, 13 < n < 17 fields of view. I, Average frequency, KW test, 148 < n < 281 values. J, Average normalized amplitude of the recorded Ca2+ transients, KW test, 607 < n < 2980 transients. K, Average duration of the Ca2+ transients, KW test, 607 < n < 2980 transients. L, Average incidence of the recorded Ca2+ transients, BFW ANOVA, 7 < n < 15 fields of view. M, Average frequency, KW test, 507 < n < 527 values. N, Average normalized amplitude of the recorded Ca2+ transients, KW test, 2442 < n < 5149 transients. O, Average duration of the Ca2+ transients, KW test, 2442 < n < 5149 transients. *p < 0.05, **p < 0.01, ***p < 0.001, ****p < 0.001, ns = non significant.
Acknowledgments
This image is the copyrighted work of the attributed author or publisher, and
ZFIN has permission only to display this image to its users.
Additional permissions should be obtained from the applicable author or publisher of the image.
Full text @ eNeuro