IMAGE

Figure 6

ID
ZDB-IMAGE-230630-43
Source
Figures for Kim et al., 2023
Image
Figure Caption

Figure 6

Toxic effects of BPF on oligodendrocytes of zebrafish larvae at 5 dpf. (
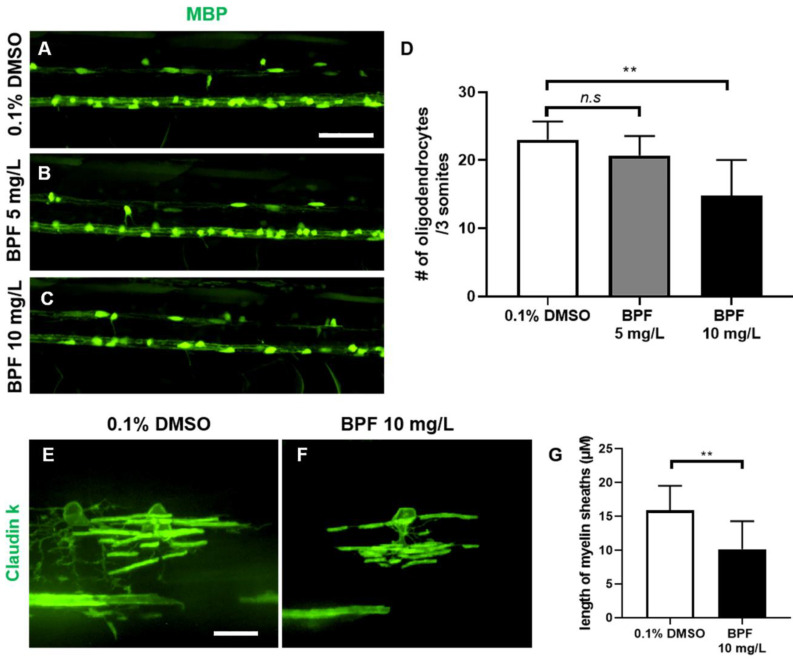
AC) Lateral views of the spinal cord of Tg(MBP:EGFP) at 5 dpf. The oligodendrocytes expressed EGFP fluorescence. (D) The graph compares the number of oligodendrocytes per three somites in 0.1% DMSO and 5, 10 mg/L BPF-treated zebrafish. n = 10 for DMSO control and BPF 10 mg/L, n = 13 for BPF 5 mg/L. (E,F) The myelin sheaths were expressed in GFP in Tg(ClaudinK:mGFP). (G) The graph compares the average length of myelin sheaths per oligodendrocyte in 0.1% DMSO and zebrafish treated with 10 mg/L BPF. n = 15 for DMSO control, n = 10 for BPF 10 mg/L. Data are presented as means ± SD. n.s.—not significant, ** p < 0.01. (AC) Scale bar, 100 µm. (EF) Scale bar, 50 µm.

Acknowledgments
This image is the copyrighted work of the attributed author or publisher, and ZFIN has permission only to display this image to its users. Additional permissions should be obtained from the applicable author or publisher of the image. Full text @ Toxics