
Fig. 1
- ID
- ZDB-IMAGE-230617-8
- Publication
- Sun et al., 2023 - hapln1a+ cells guide coronary growth during heart morphogenesis and regeneration
- All Figures
- Figures for Sun et al., 2023
|
Fig. 1
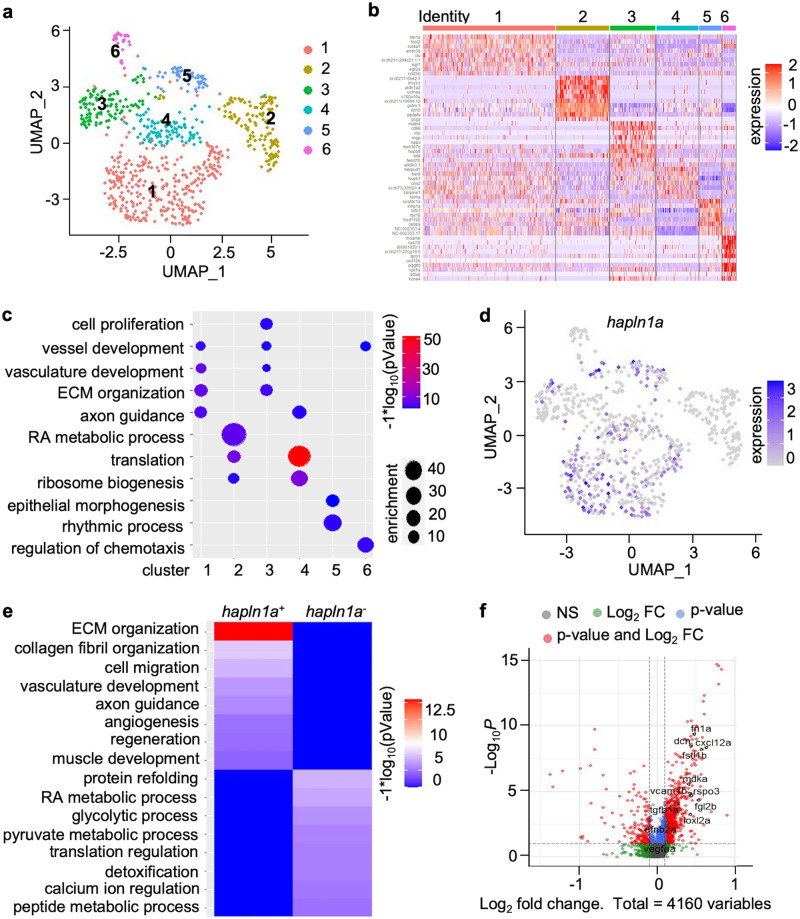
a Uniform manifold approximation and projection (UMAP) clustering of tcf21+ single-cells from juvenile hearts. b Heatmap of the top 10 markers for epicardial cells from juvenile tcf21:nucEGFP hearts. c Identification of epicardial cell clusters based on gene ontology analysis. d Feature plot of hapln1a expression in epicardial clusters of juvenile hearts. e Heatmap of gene ontology enrichment for tcf21+/hapln1a+ epicardial cells vs. tcf21+/hapln1a- cells. f Log2-fold-change vs. abundance of normalized gene expression of tcf21+/hapln1a+ epicardial cells vs. tcf21+/hapln1a- cells. Each point designates a unique gene; differentially expressed unique genes are in red. Unique genes with higher expression in tcf21+/hapln1a+ epicardial cells have positive fold-change values, whereas unique genes with higher expression in tcf21+/hapln1a- cells have negative fold-change values.