
Fig. 8
- ID
- ZDB-IMAGE-230617-15
- Publication
- Sun et al., 2023 - hapln1a+ cells guide coronary growth during heart morphogenesis and regeneration
- All Figures
- Figures for Sun et al., 2023
|
Fig. 8
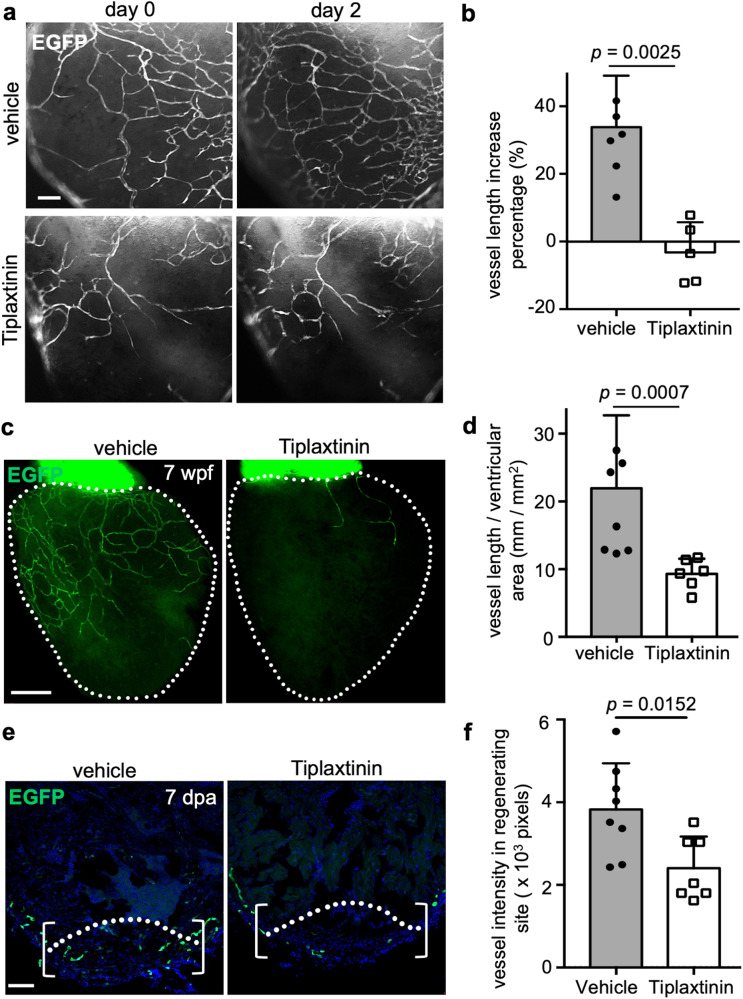
a Daily imaging of EGFP+ coronary cells in juvenile deltaC:EGFP ventricular surface treated with serpine1 inhibitor (n = 7) or vehicle treatment (n = 5) ex vivo. The experiment was repeated once. Scale bars, 50 µm. b Quantification of the percentage of EGFP+ pixels on the ventricular surface from experiments in a. The experiment was repeated once with similar results. Mann–Whitney rank-sum test (two-sided). Data are presented as mean values ± SD. Source data are provided as a Source Data file. c Visualization of EGFP+ coronary cells in whole-mounted juvenile deltaC:EGFP hearts at the age of 7 wpf after serpine1 inhibitor (n = 6) and vehicle treatment (n = 8). The experiment was repeated once. White dashed lines, ventricle. Scale bars, 200 µm. d Quantification of the percentage of EGFP+ pixels on the ventricular surface from experiments in c. The experiment was repeated once with similar results. Mann–Whitney rank-sum test (two-sided). Data are presented as mean values ± SD. Source data are provided as a Source Data file. e Section images of ventricles of vehicle- or serpine1 inhibitor-treated deltaC:EGFP animals at 30 dpa, assessed for EGFP+ coronary cells in the injury site. n = 8 in vehicle control and n = 7 in serpine1 inhibitor-treated group. The experiment was repeated once. Brackets, injury site used for quantification. Dashed line indicates amputation plane. Scale bars, 50 µm. f Quantification of the percentage of EGFP+ pixels in the regenerating area from experiments in e. The experiment was repeated once with similar results. Mann–Whitney rank-sum test (two-sided). Data are presented as mean values ± SD. Source data are provided as a Source Data file.