
Fig. 4
- ID
- ZDB-IMAGE-230617-11
- Publication
- Sun et al., 2023 - hapln1a+ cells guide coronary growth during heart morphogenesis and regeneration
- All Figures
- Figures for Sun et al., 2023
|
Fig. 4
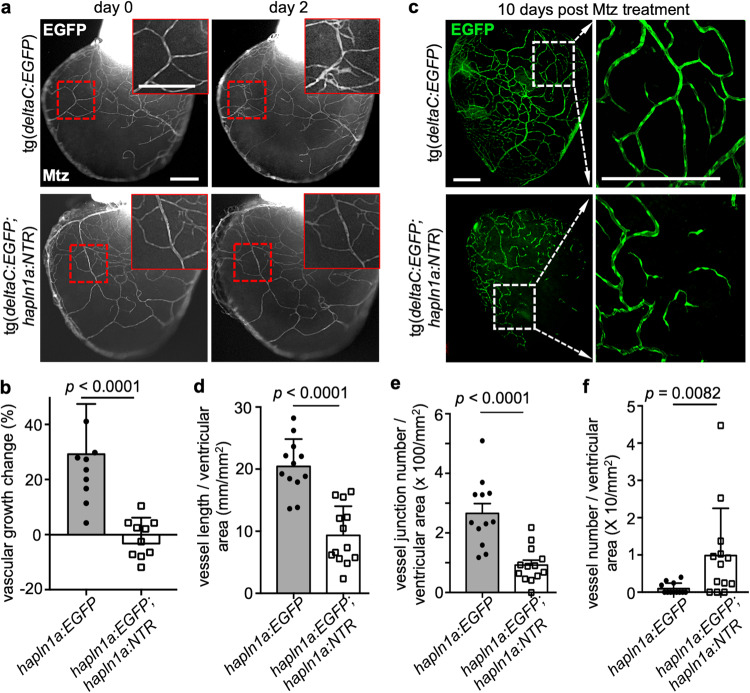
a Obvious ex vivo deltaC+ cell growth (red boxes included) within 2 days in control deltaC:EGFP hearts and no growth in deltaC:EGFP;hapln1a:NTR hearts, after Mtz treatment. The experiment was repeated once. Scale bar, 200 µm. b Quantification of pixels of EGFP+ signals at day 2 versus that at day 0 in experiment (a). n = 11 in each group. Mann–Whitney rank-sum test (two-sided). Data are presented as mean values ± SD. Source data are provided as a Source Data file. c Whole-mount view of the ventricular surface from in vivo juvenile deltaC:EGFP;hapln1a:NTR (n = 13) and deltaC:EGFP (n = 12) clutchmates at the age of 8 wpf that were treated with 10 mM Mtz for 12 h at day 0, day 1, and day 5, and then the hearts were extracted at day 10 and analyzed. The experiment was repeated once. Scale bars, 200 µm. d–f Quantification of pixels of EGFP+ signals (d), vessel junctions (e), and isolated vessels (f) versus whole ventricular area in experiment c. In the quantifications in d, e, f, n = 13 juvenile deltaC:EGFP;hapln1a:NTR fish and n = 12 juvenile deltaC:EGFP fish. The experiment was repeated once with similar results. d, e, f, Mann-Whitney Rank Sum test (Two-sided). Data are presented as mean values ± SD. Source data are provided as a Source Data file.