
|
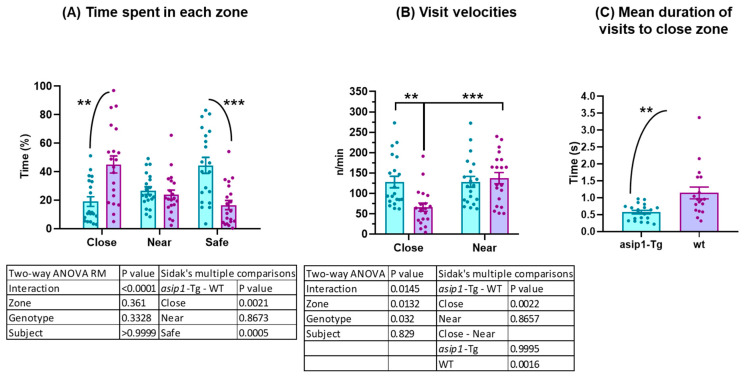
Figure 3
Behavioural differences between asip1-Tg and WT in the mirror–image stimulus test. (A) Time spent in three previously defined areas: (i) a safe area consisting of the bottom part of the tank; (ii) an area near the mirror; and (iii) an area close to the mirror where direct contact of the fish with the mirror may take place. (B) Visits’ velocity is computed as the number of entries per minute spent near or close to the mirror. (C) Mean duration of visits to the close area. Experiments were performed on 20 WT and 20 asip1-Tg fish. Data are represented as mean ± SEM and analysed by two-way ANOVA repeated measures (RM) followed by Sidak’s multiple comparison tests for (A,B) or unpaired t-test for (C). Asterisks indicate statistical differences between genotypes (** p ≤ 0.01, *** p ≤ 0.001). Blue and purple colours represent asip1-Tg and WT fish, respectively.