
|
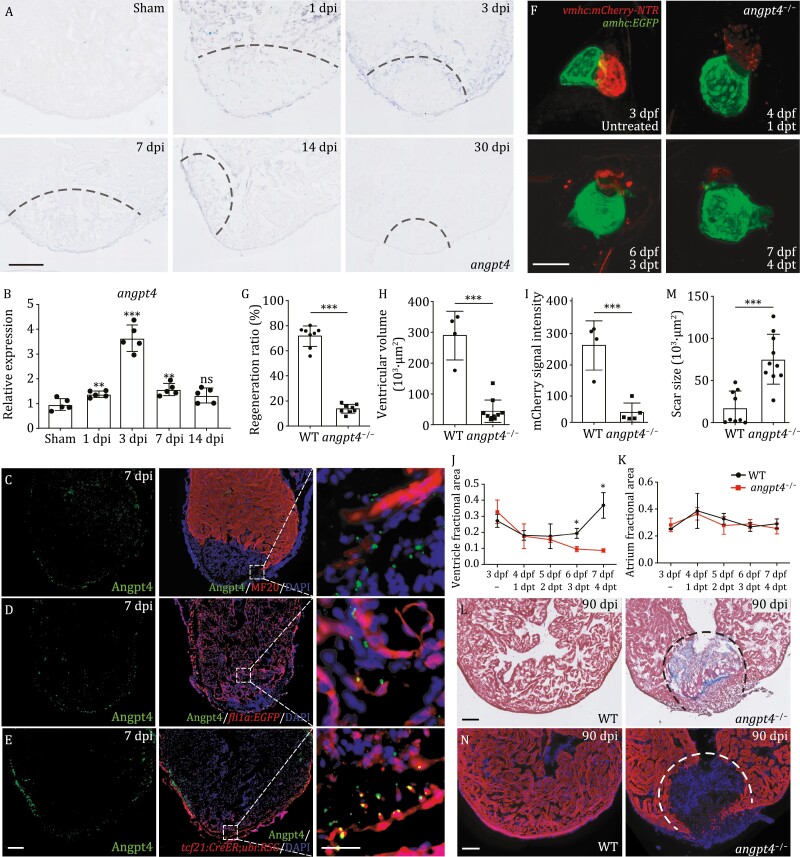
Figure 3.
Angpt4 is a key regulator for embryonic and adult heart regeneration. (A) In situ hybridization results on tissue cryosections of adult wildtype zebrafish heart at different stages after cryoinjury. The results showed that angpt4 is transiently up-regulated during heart regeneration. Representative images of three independent replicates are shown. dpi, days post-cryoinjury. Scale bar, 100 μm. (B) qRT-PCR results showing the expression levels of angpt4 during heart regeneration. Two-tailed Student’s t-test, ns, not significant, **P < 0.01, ***P < 0.001. n = 5 for each group. Error bar represents standard deviation. (C) Immunostaining results of Angpt4 (green) and MF20 (red; labeling cardiomyocytes) in 7 dpi zebrafish heart cryosections. Right panel shows the enlarged view of the rectangle region. (D) Immunostaining results of Angpt4 (green) and EGFP (red) in Tg (fli1a:EGFP) heart cryosections at 7 dpi. Right panel shows the enlarged view of the rectangle region. (E) Immunostaining results of Angpt4 (green) and EGFP (red) in Tg (tcf21:CreER; ubi:loxP-dsRed-STOP-loxP-EGFP) heart sections at 7 dpi. ubi:loxP-dsRed-STOP-loxP-EGFP was abbreviated as ubi:RSG. Scale bar, 100 μm. Right panel shows the enlarged view of the rectangle region. Scale bar, 25 μm. (F) Maximum intensity projections of angpt4 mutant embryos with or without MTZ-treatment under Tg (vmhc:mCherry-NTR; amhc:EGFP) transgenic background, showing the failure to regenerate ventricular cardiomyocytes (marked by red fluorescent signal). dpf, days post fertilization. dpt, days post-treatment. Scale bar, 50 μm. (G) Statistical analysis results of successful regeneration ratio in MTZ-treated WT and angpt4 mutant embryos. Two-tailed Student’s t-test, ***P < 0.001. n = 8 for each group. Error bar represents standard deviation. (H–K) Statistical analysis results of ventricular volume (H), mCherry fluorescence intensity (I), ventricle fractional area (J) and atrium fractional area (K) in MTZ-treated WT and angpt4 mutant embryos. Fractional area change = (Diastolic area − Systolic area)/Diastolic area. Two-tailed Student’s t-test, *P < 0.05, ***P < 0.001. n = 4–10 for each group. Error bar represents standard deviation. (L) Representative Masson’s trichrome staining results of adult WT and angpt4−/− zebrafish heart cryosections prepared at 90 dpi. angpt4−/− hearts showed larger scar area than WT hearts. Red, muscle cells stained with acid fuchsin; blue, collagen stained with aniline blue. Dotted line indicates scar area. Scale bar, 100 μm. (M) Statistical analysis results of scar size in 90 dpi of WT and angpt4−/− hearts. Two-tailed Student’s t-test, ***P < 0.001. n = 9–10 for each group. Error bar represents standard deviation. (N) Immunofluorescence staining results of cardiomyocyte marker MF20 in WT and angpt4−/− hearts at 90 dpi. Dotted line indicates scar area. Scale bar, 100 μm.