
|
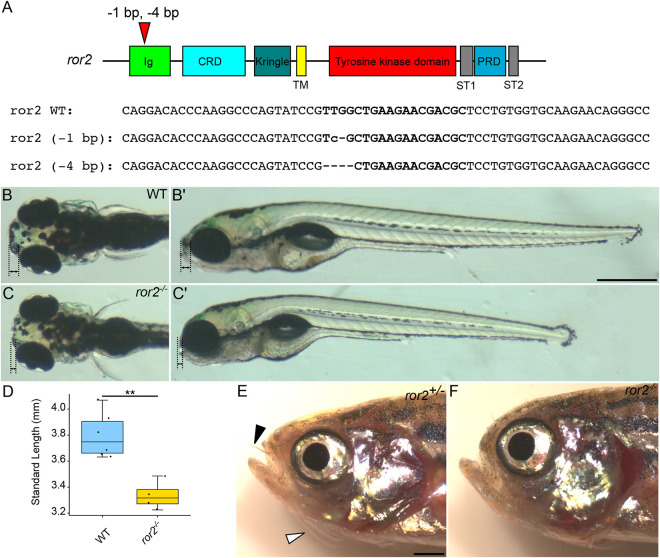
Fig. 2.
ror2 mutants have craniofacial abnormalities and defects associated with disrupted cell polarity. (A) Diagram of zebrafish ror2 gene with domains annotated. Red triangle indicates gRNA target sites and the two alleles recovered. Bold text indicates gRNA target sites in the selected genomic DNA sequences. (B-C′) Representative images of 5 dpf wild type (WT) (B,B′) and MZ-ror2 (C,C′) mutants. Dorsal (B,C) and lateral (B′,C′) views. Black dotted lines with double arrows indicate tissue anterior to the eyes. (D) Box plot comparing standard lengths of WT (n=6) and ror2−/− (n=4) embryos at 5 dpf. **P<0.01 (Wilcoxon rank-sum test). Box plot shows the median (middle bar) and first to third interquartile ranges (boxes); whiskers indicate 1.5× the interquartile ranges; dots indicate data points. (E,F) Phenotypically WT ror2+/− (E) and ror2−/− (F) adults. Black arrowhead indicates nasal barbel and white arrowhead indicates maxillary barbel. Ig, immunoglobulin-like domain; CRD, cysteine-rich domain; Kringle, Kringle domain; TM, transmembrane domain; ST1, serine-threonine domain 1; ST2, serine-threonine domain 2; PRD, proline-rich domain. Scale bars: 500 µm for B-C′; 1 mm for E,F.