
|
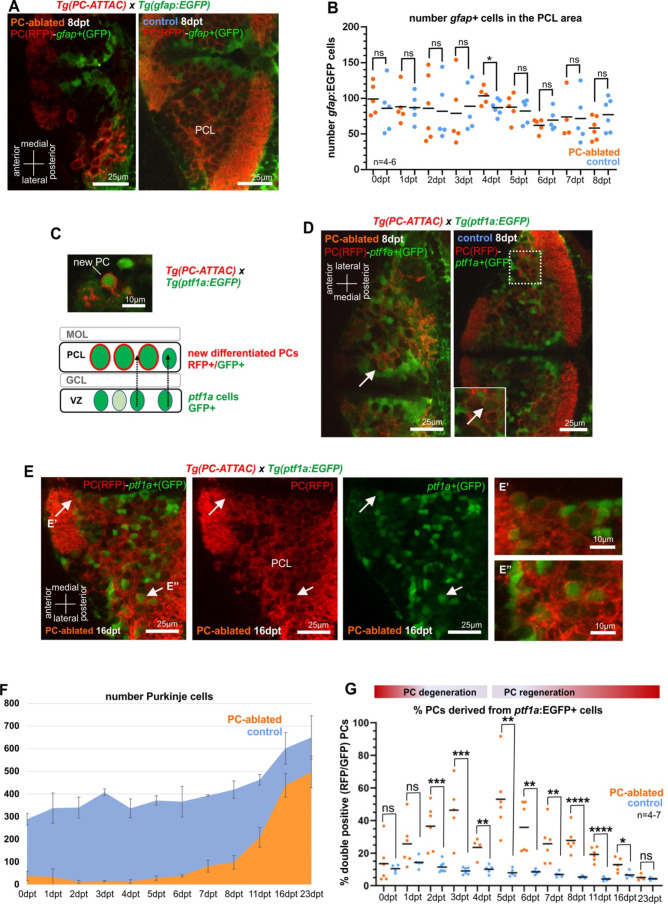
Figure 2
(A) Images of larval cerebellum of the double transgenic line Tg(PC-ATTAC)/Tg(gfap:EGFP) after induced PC ablation. (B) Number of gfap+ cells throughout the PC layer area during PC degeneration and beginning of regeneration. (C) Illustration of new PC development from ptf1a+ progenitors. (D, E) Images of larval cerebellum of the double transgenic line Tg(PC-ATTAC)/Tg(ptf1a:EGFP) after induced PC ablation, revealing double-positive cells (arrows). Average of PC numbers (F) and percentage of PCs showing GFP fluorescence double-positive cells, (G) during degeneration and regeneration of PCs. The red fluorescent protein from the PC-ATTAC strain is exclusively expressed in the cell membrane, while EGFP from the ptf1a- and gfap-reporter strains localizes to the cytoplasm. GFP and RFP were enhanced by fluorescence immunohistochemistry in A, C–E. Statistical information: statistical method=unpaired t-test two tailed, levels of significance=P<0.05 (*), P<0.01 (**), P<0.001 (***), P<0.0001 (****). Additional information in Supplementary file 1.
Cellular analysis of potential progenitors of regenerating Purkinje cells (PCs).