
|
Figure 1
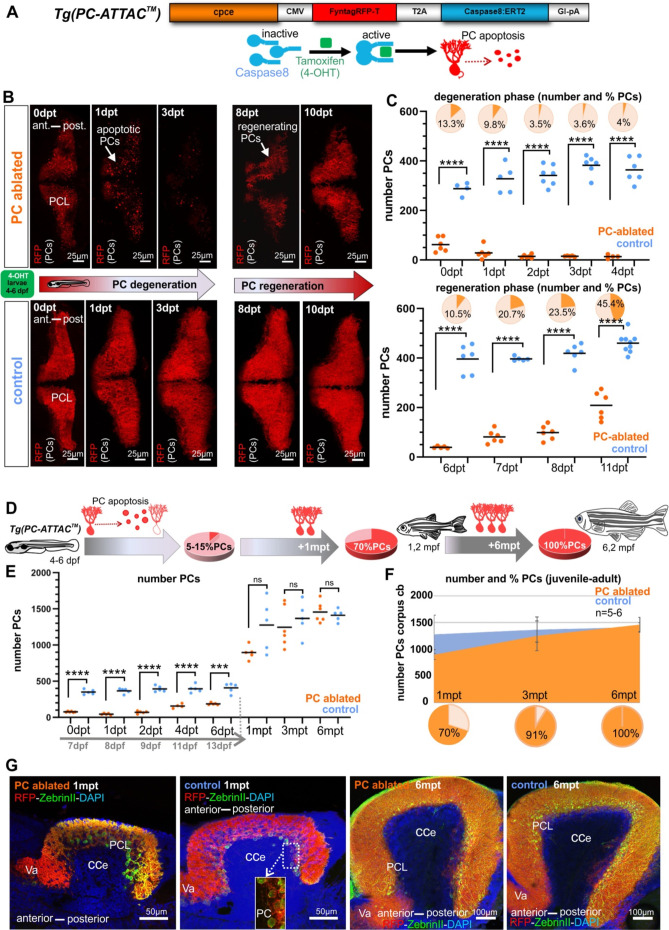
(A) Construct used to generate the Tg(PC-ATTAC) transgenic line, modified from Weber et al., 2016. (B) Images of the PC layer (fyn-tagRFP-T fluorescence expressed in mature PCs) after induced PC ablation in larvae at 4–6 dpf monitoring 10 days after 4-hydroxy-tamoxifen (4-OHT) treatment. (C) Number and percentage of PCs in ablated (4-OHT) vs control (EtOH) larvae. (D–G) Quantitative monitoring of PC regeneration after induced PC ablation in larvae. (D–F) Numbers and percentage of PCs until 6 mpt. (G) Images of PCs on sagittal cerebellar sections after immunostaining with anti-tagRFP and anti-ZebrinII antibodies, comparing ablated and control groups at 1 and 6 mpt. Statistical information: sample size n=4-9, statistical method=unpaired t-test two tailed, levels of significance=P <0.0001 (****), P=0.0001 (***). Additional information in Supplementary file 1.
Induced Purkinje cell (PC) ablation in zebrafish larvae: time course of degeneration and regeneration.