
Image
|
Figure Caption
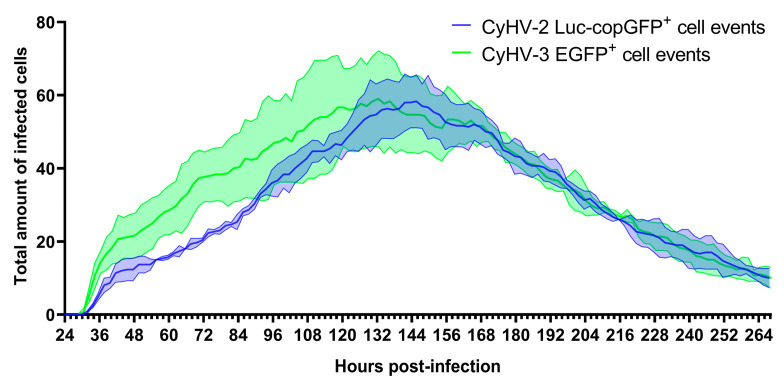
Figure 3
Quantification of CyHV-2 and CyHV-3-infected cells in ZF4 monolayer over time. This data was acquired via time-lapse fluorescent microscopy (IncuCyte). Cells were cultured in a 24-well plate and infected with CyHV-2 Luc-copGFP or CyHV-3 EGFP recombinants (1.2 × 10⁶ PFU/mL for each recombinant). At 24 hpi, cells were imaged every 2 h for 11 days. Data represent the mean ± standard errors from three replicates/wells. Data from each replicate at each timepoint represent the sum of fluorescent cells observed in nine separate locations of each well.
Acknowledgments
This image is the copyrighted work of the attributed author or publisher, and
ZFIN has permission only to display this image to its users.
Additional permissions should be obtained from the applicable author or publisher of the image.
Full text @ Viruses