
|
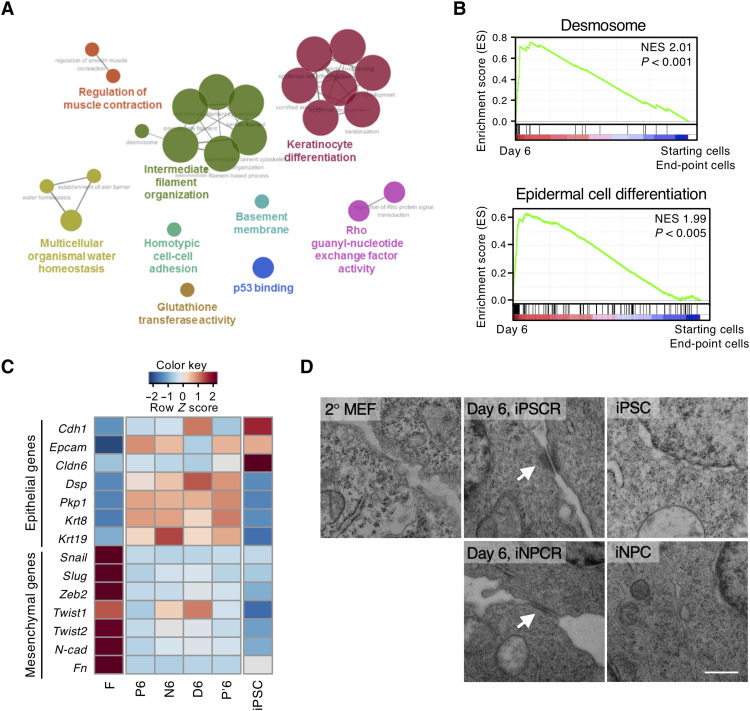
Fig. 2
(A) Network-based analysis of GO terms under the classifications biological process, cellular component, immune system, and molecular function in the 244 common genes visualized by ClueGO. Major GO terms are represented at the node (P < 0.08). The linked lines between nodes were created on the basis of a predefined κ score level (>0.4). The node size represents the P value (P < 0.001; 0.001 < P < 0.05; 0.05 < P < 0.1). (B) Gene set enrichment analysis (GSEA) showing that “desmosome” and “epidermal cell differentiation” represent the highest normalized enrichment score (NES). GSEA was performed using transcriptomes of ICs (day 6 samples in 2° MEF and 4F2A MEF reprogramming) versus transcriptomes of starting cells (2° MEFs and 4F2A MEFs) and end-point cells (P12, P′12, N12, and D12 of 2° MEFs, iPSCs, and iNPCs of 4F2A MEFs). NESs and P values are shown. (C) Heatmap showing the expression of indicated genes, including epithelial and mesenchymal markers. (D) Representative TEM images of cellular junction regions in 2° MEFs, day 6 samples of iPSCR and iNPCR, iPSCs, and iNPCs. White arrows indicate mature desmosome. Scale bar, 0.5 μm. Data are representative of experimental duplicates.