
|
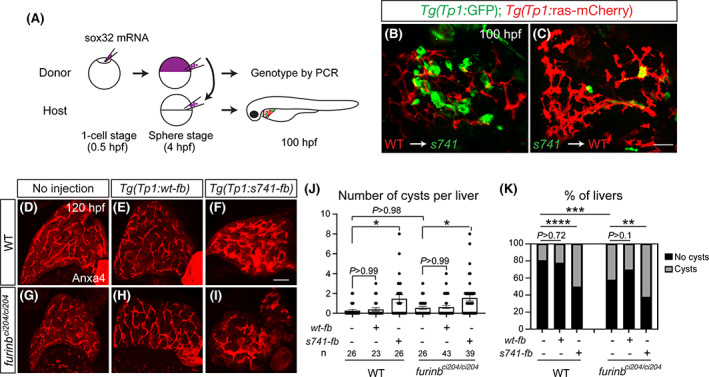
Fig. 4
The mutant Furinb protein acts within the biliary cells to disrupt bile duct morphogenesis. (A) Schematic diagram of the genetic mosaic analysis for determining the cell autonomy of the mutant Furinb function. (B,C) Representative results of the genetic mosaic analysis. (B) WT donor cells transplanted into the s741 mutant host liver (6 of 6 host fish exhibited the representative phenotype). (C) s741 mutant donor cells transplanted into the WT host liver (10 of 10 host fish exhibited the representative phenotype). In both (B) and (C), the WT biliary cells expressed Tg(Tp1:ras‐mCherry) (red) and the s741 mutant biliary cells expressed Tg(Tp1:GFP) (green). (D–I) Confocal 3D projections of larvae stained with biliary marker Anxa4. Ventral view; anterior is on the top. (J,K) Numbers (mean ± SEM) of cysts per liver (J) and percentages of livers with cysts based on Anxa4 staining (K). In (J), each dot represents individual liver. Statistical significance was calculated by one‐way ANOVA and Tukey's post‐hoc test (J), and calculated by Fisher's exact test (J): *p < 0.05; **p < 0.01, ***p < 0.001; ****p < 0.0001. Scale bars: 30 μm (B,C) and 40 μm (D–I).