
|
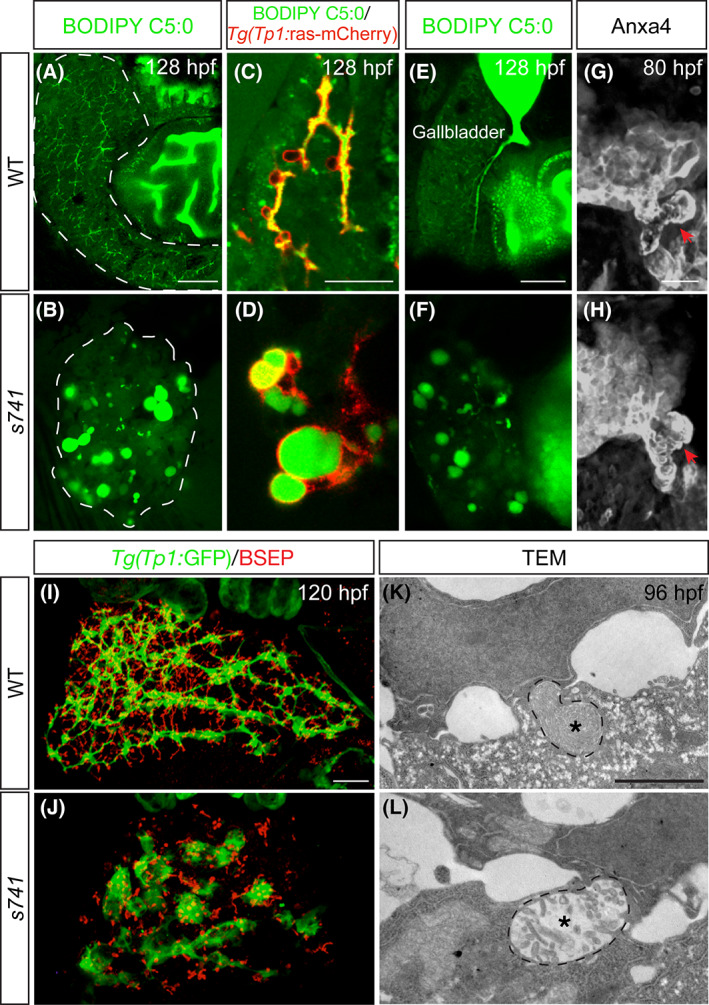
Fig. 2
s741 mutants form fluid‐filled cysts in the liver. (A–F) Fluorescent micrographs of larval livers showing that the mutant liver retained BODIPY in the nodules. (C,D) Fluorescent micrograph images under higher magnification with Tg(Tp1:ras‐mCherry) (red) transgene that marked the biliary cells. Twenty WT and 20 mutants were examined and all showed the representative phenotype. (G,H) Confocal 3D projections of the hepatopancreatic ductal system stained by Anxa4 antibody. Red arrows point to the gallbladder. (A–D,E–F) Lateral views taken from the left and right side of the fish, respectively. Anterior is on the left. (I,J) Confocal 3D projections showing the biliary cells marked by Tg(Tp1:GFP) expression (green) and bile canaliculi stained by bile salt export pump (BSEP) antibody. (G–J) Ventral views; anterior is on the top. Ten WT and 10 mutants were examined and all showed the representative phenotypes. (K,L) Representative transmission electron microscopy (TEM) images of the bile canaliculi (outlined by dashed line) at 96 hpf. Asterisks point to actin microvilli within the bile canaliculi. Six WT and 6 mutants were examined. Scale bars: 50 μm (A,B,E,F); 30 μm (C,D,G–J); and 2 μm (K,L).