
|
Fig. 5
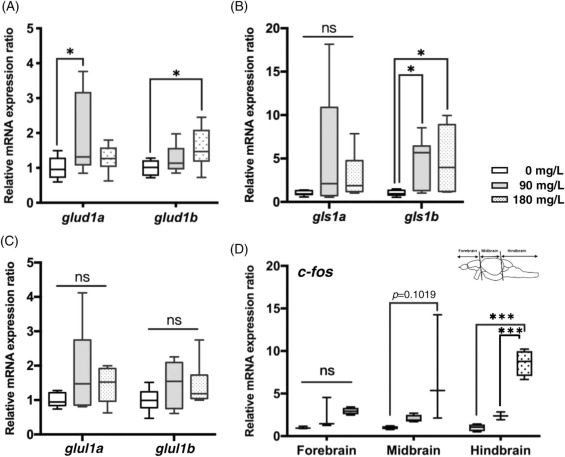
Fig. 5. Effects of ammonia exposure for 4 h on mRNA expressions in the brain of zebrafish. Schematic illustration of the glutamate-glutamine cycle. mRNA expressions of glutamate dehydrogenase 1a (glud1a) and glud1b (A); glutaminase 1a (gls1a) and gls1b (B); and glutamine synthase 1a (glula) and glulb (C); in the 0, 90, and 180 mg/L (NH4+) groups. mRNA expression of glud1b increased in the brain of the 180 mg/L (NH4+) group while gls1b increased the 90, and 180 mg/L (NH4+) groups. mRNA levels of c-fos (D) in the forebrain, midbrain and hindbrain of zebrafish. c-fos expression was stimulated in the hindbrain of the 180 mg/L (NH4+) groups, while it was not affected in the forebrain. Data are shown as the mean ± SD. * Indicates a significant differences from 0 mg/L, according to a one-way ANOVA with Tukey’s pair-wise comparison, p < 0.05.