
|
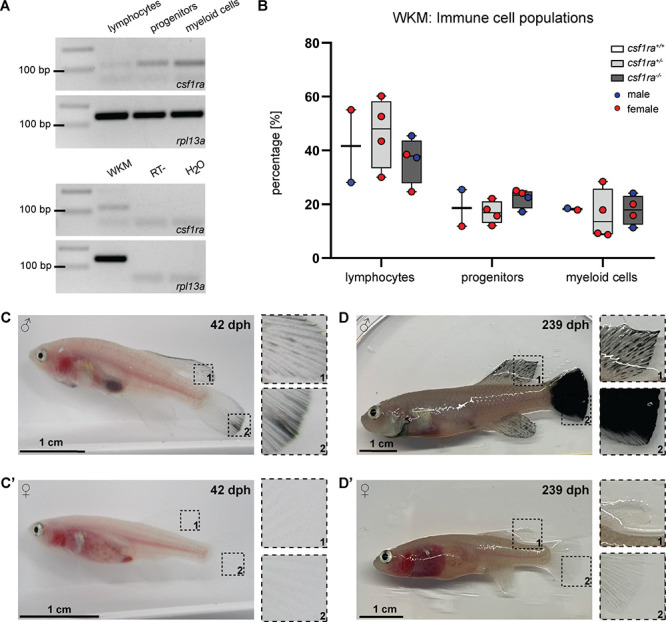
Figure 2
(A) Expression of csf1ra was analyzed via RT-PCR using cDNA from FACS-sorted populations of lymphocytes, progenitors, and myeloid cells obtained from the whole kidney marrow (WKM) of a wild-type N. furzeri. Csf1ra was detected in all subpopulations, most strongly in myeloid cells. As a negative control, an RT-sample (no reverse transcriptase during cDNA synthesis) was used to exclude contaminations with genomic DNA. As loading control, rpl13a was used. (B) Comparison of cell numbers in the different subpopulations of the WKM of fish with the following genotypes: mitfa-/-, ltk-/-, csf1ra+/+ (n=2), mitfa-/-, ltk-/-, csf1ra+/- (n=4), and mitfa-/-, ltk-/-, csf1ra-/- (n=4). One-way ANOVA followed by Tukey’s post hoc test did not reveal any significant differences. Horizontal line represents median. Whiskers show min. to max. value. (C,C’) Male klara fish (C) showed an appearance of melanophores on fin appendages, which was not observed in females (C’). (D,D’) Occurrence of melanophores intensified with age resulting in black fins in male fish (D). In female klara animals (D’) black fins were not observed.
Characterization of klara.