
|
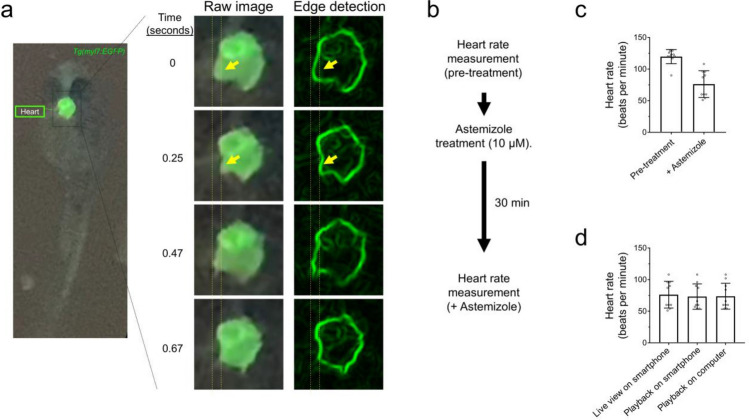
Figure 5
Glowscope detection of drug-induced changes to heart rate in transgenic zebrafish embryos. (a) Left fluorescence image shows GFP expression in the heart of a Tg(myl7:EGFP) embryo (ventral view). The boxed region is further magnified in the middle column, which from top to bottom show chamber movements across a video acquired on an iPhone 11 Pro smartphone. To aid viewing of chamber movements, these videos were transferred to a laptop, opened in ImageJ (free software), and processed using edge detection, which outlines the walls of the chambers. Static arrows highlight heart chamber movements. (b) Flow chart of the pre- and post-imaging of zebrafish heart rate in response to astemizole treatment (10 µM). (c) Plots show the average heart rate of zebrafish embryos prior to and after treatment with astemizole. n = 10 animals measured in one independent experiment, P = 0.0002, paired two-tailed t-test. (d) Summary of measurements conducted while recording the video in real time (left bar), viewed on the smartphone after recording the video (middle bar), or viewed on a laptop (right bar). N = 10 animals measured in one independent experiment, P = 0.942, one-way ANOVA. For panels (c–d), scatter plot points represent individual zebrafish (heart) rate measurements and error bars represent standard deviation.