
|
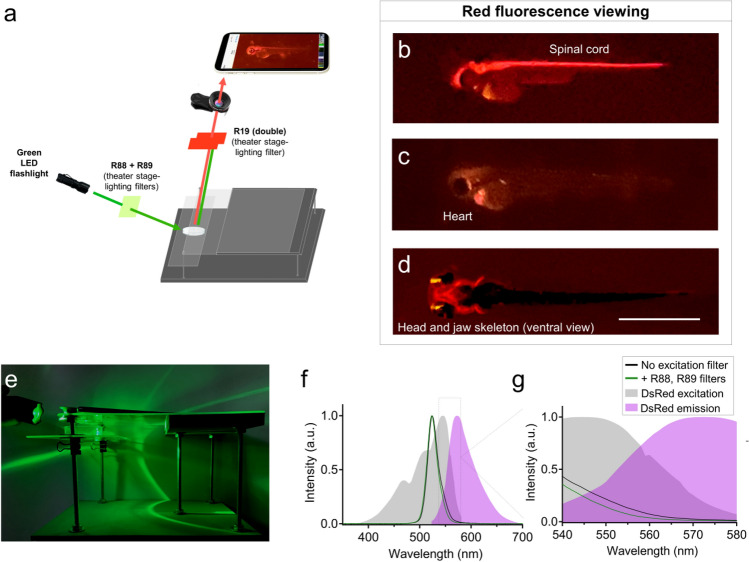
Figure 3
Glowscope detection of red fluorescent proteins. (a) Schematic of components used for red fluorescence viewing on the glowscope. In comparison to green fluorescence viewing, flashlight and filters are changed, but the remainder of the glowscope is unchanged. (b–d) Representative fluorescence images of transgenic zebrafish embryos (3–4 dpf, lateral views) expressing red fluorescence in cell-type specific patterns. Reporter lines viewed include Tg(olig2:DsRed) (b), Tg(myl7:mCherry) (c), and Tg(sox10:mRFP) (d). Scale bar is 1 mm. (e) Image shows the glowscope in use for red fluorescence viewing. (f–g) Plots show the green LED flashlight emission wavelength (black and green lines, measured using a Vernier spectrometer) in comparison to the excitation profile of DsRed (gray, obtained from www.fpbase.org). The dashed box region in panel (f) is further magnified in panel (g) to show the effect of the R88 + R89 filters with greater detail. Images in panels (b–c) were acquired using an Apple iPhone XR and panel (d) was acquired using an iPhone 12 Pro.