
Fig. 2.
- ID
- ZDB-IMAGE-230228-47
- Publication
- Fan et al., 2023 - Gaucher disease protects against tuberculosis
- All Figures
- Figures for Fan et al., 2023
|
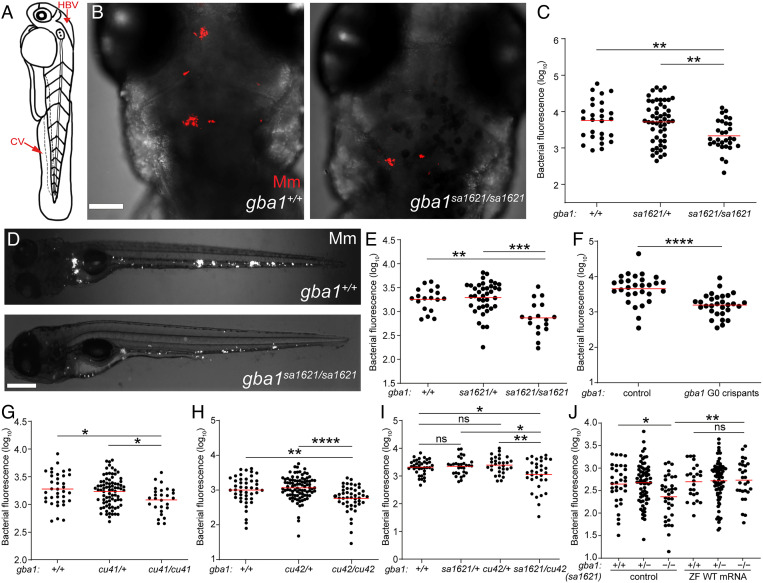
Fig. 2.
gba1 mutant zebrafish are resistant to Mm infection. (A) Illustration of a zebrafish larva showing the HBV and CV injection sites. (B) Maximum intensity projection of representative confocal images of zebrafish larval HBV at 3 dpi after HBV infection with 100 to 150 Mm. (Scale bar, 80 μm.) (C) Quantification of HBV bacterial burden measured by fluorescence per animal from (B). Horizontal red bars, means; **P < 0.01 (one-way ANOVA with Tukey’s posttest). Representative of more than three independent experiments. (D) Representative images of zebrafish larvae at 5 dpi after CV infection with 200 to 300 Mm. (Scale bar, 300 μm.) (E) Quantification of the bacterial burden measured by fluorescence per animal from (D). Horizontal bars, means; **P < 0.01; ***P < 0.001 (one-way ANOVA with Tukey’s posttest). Representative of more than three independent experiments. (F) Bacterial burden measured by fluorescence per animal in wild-type and gba1 G0 crispants at 5 dpi after CV infection with 200 to 300 Mm. Horizontal bars, means; ****P < 0.0001 (Student’s unpaired t test). Representative of more than three independent experiments. (G) Bacterial burden measured by fluorescence in 5 dpi gba1cu41/+ incross larvae after CV infection with 200 to 300 Mm. Horizontal bars, means; *P < 0.05 (one-way ANOVA with Tukey’s posttest). Representative of two independent experiments. (H) Bacterial burden measured by fluorescence in 5 dpi gba1cu42/+ incross larvae after CV infection with 200 to 300 Mm. Horizontal bars, means; **P < 0.01; ****P < 0.0001 (one-way ANOVA with Tukey’s posttest). Representative of more than three independent experiments. (I) Bacterial burden measured by fluorescence in wild-type, sa1621 and cu42 heterozygotes, and sa1621/cu42 compound mutant siblings at 5 dpi after CV infection with 200 to 300 Mm. Horizontal bars, means; ns, not significant; *P < 0.05; **P < 0.01 (one-way ANOVA with Tukey’s posttest). (J) Bacterial burden measured by fluorescence in gba1sa1621/+ incross larvae, injected with zebrafish WT gba1 mRNA (200 ng/μL) or vehicle control, 5 dpi after CV infection with 200 to 300 Mm. Horizontal bars, means; ns, not significant; *P < 0.05; **P < 0.01 (one-way ANOVA with Tukey’s posttest). Representative of two independent experiments.