
Image
|
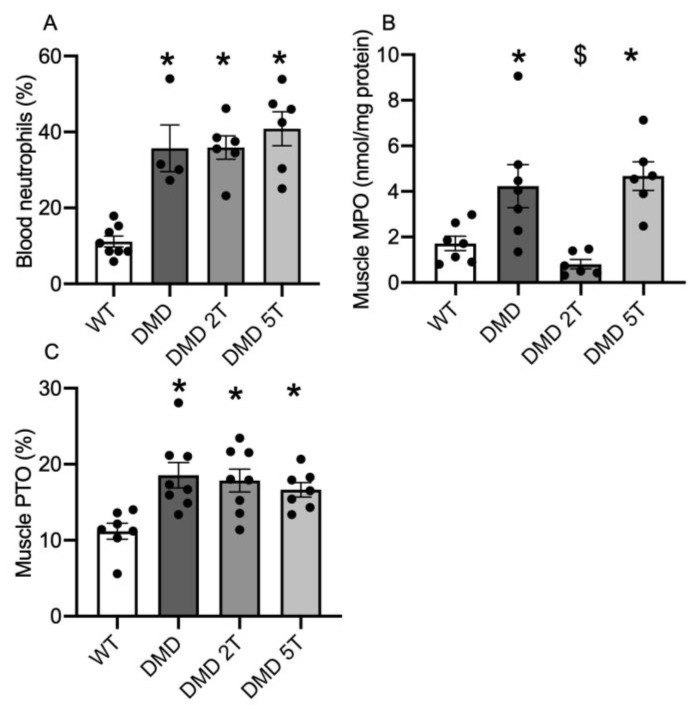
Figure Caption
Figure 3
Markers of inflammation and oxidative stress in WT and untreated and taurine-treated DMDmdx rats (at 2 doses) aged 12 weeks. Levels of plasma neutrophils (A) and muscle MPO (B) and oxidative stress measured as protein thiol oxidation (PTO) (C). * = significantly (p < 0.05) different to WT. $ = significantly (p < 0.05) different to untreated DMDmdx rats. Bars represent mean ± SEM and n = 8–10 per group.
Acknowledgments
This image is the copyrighted work of the attributed author or publisher, and
ZFIN has permission only to display this image to its users.
Additional permissions should be obtained from the applicable author or publisher of the image.
Full text @ Metabolites