
|
Fig. 5
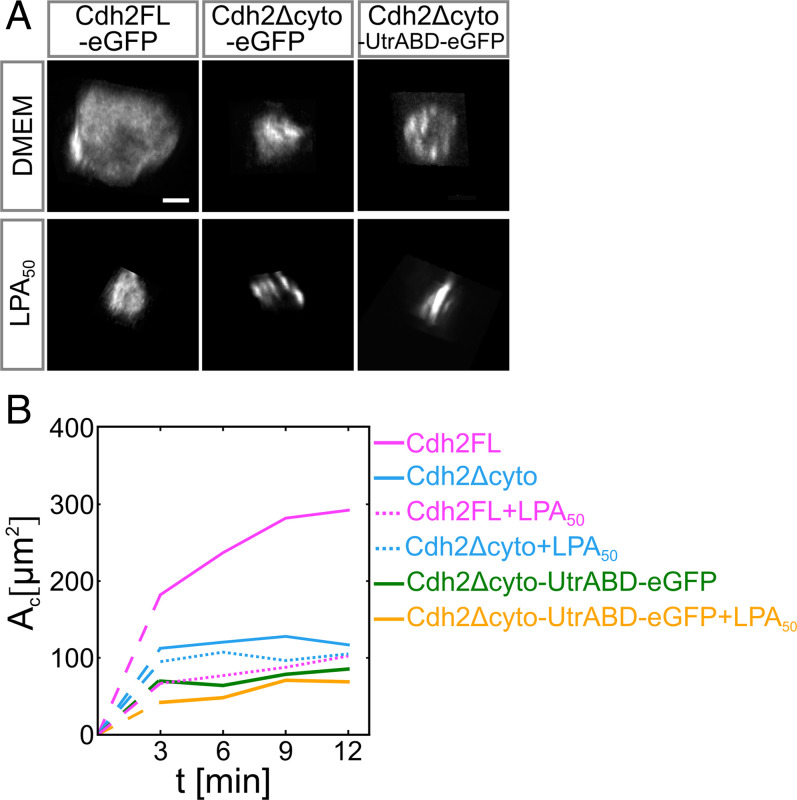
Defective cytoskeletal anchoring of the cadherin adhesion complex suppresses the effect of cortical tension on contact expansion. (A) Subcellular localization of Cdh2FL-eGFP, Cdh2Δcyto-eGFP, and Cdh2Δcyto‐UtrABD-eGFP at the contact of doublets in the presence or absence of 50 nM LPA. (Scale bar: 5 μm.) (B) Cell–cell contact size (Ac) in doublets expressing either Cdh2FL (pink), Cdh2Δcyto (blue), or Cdh2Δcyto‐UtrABD-eGFP (green and yellow) in the presence (dotted lines, yellow for Cdh2Δcyto‐UtrABD-eGFP) or absence (solid lines, green for Cdh2Δcyto‐UtrABD-eGFP) of 50 nM LPA. Dashed lines connect contact formation (0 min) with the first time point when data were collected. SDs are shown in SI Appendix, Fig. S8. (Cdh2FL) N = 2, n = (3 min: 8, 6 min: 8, 9 min: 8, 12 min: 8); (Cdh2Δcyto) N = 2, n = (3 min: 14, 6 min: 14, 9 min: 14, 12 min: 14); (Cdh2Δcyto + LPA50) N = 2, n = (3 min: 9, 6 min: 9, 9 min: 9, 12 min: 9); (Cdh2FL + LPA50) N = 2, n = (3 min: 10, 6 min: 10, 9 min: 10, 12 min: 10); (Cdh2Δcyto-UtrABD-eGFP) N = 3, n = (3 min: 5, 6 min: 5, 9 min: 5, 12 min: 5); (Cdh2Δcyto-UtrABD-eGFP + LPA50) N = 1, n = (3 min: 3, 6 min: 3, 9 min: 3, 12 min: 3). If not stated otherwise, N corresponds to the number of experiments, and n corresponds to the number of cell doublets.