
|
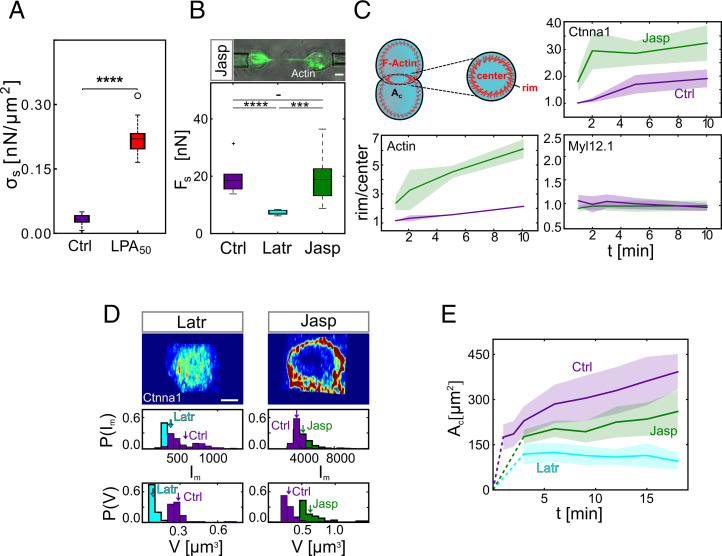
Fig. 4
Enhanced cytoskeletal anchoring of the cadherin adhesion complex by cortical tension limits contact expansion in doublets. (A) Contact stress (σc) for control progenitor cell doublets and doublets exposed to 50 nM LPA after 10-min contact time. (Ctrl) N = 13 and total n = 17; (LPA50) N = 7 and total n = 12. ****P value = 3.6e-17 Student’s t test. (B) Separation force (Fs) for control doublets and doublets exposed to 300 nM Latr or 100 nM Jasp. Upper shows actin-rich tethers formed between the cells during separation in the presence of Jasp. (Ctrl) N = 3 and n = 10; (Latr) N = 1 and n = 8; (Jasp) N = 3 and n = 13. (Ctrl–Jasp) Not significant (t test with Bonferroni correction for multiple comparisons). ***(Latr–Jasp) P value = 6.96e-4; ****(Ctrl–Latr) P value = 1.92e-5. (Scale bar: 5 μm.) (C) Rim to center mean intensity ratios for F-actin, myosin II, and Ctnna1 as a function of contact time (1, 2, 5, and 10 min) in the presence or absence of Jasp. F-actin was visualized by Phalloidin with N = 3; (Ctrl) n = 5, 3, 3, and 3 (corresponding to the different contact times mentioned above); and (Jasp) n = 3, 4, 3, and 4. Ctnna1 was visualized by immunohistochemistry with N = 1; (Ctrl) n = 5, 3, 5, and 5; and (Jasp) n = 3, 3, 3, and 4. Myosin II was visualized by Myl12.1-eGFP expression with N = 1; (Ctrl) n = 9, 8, 7, and 8; and (Jasp) n = 12, 9, 11, and 8. The shadowed areas denote SD. (D) Exemplary Airy Scan images of Ctnna1 subcellular localization at the contact edge of doublets exposed to Latr or Jasp. Quantifications below show cluster mean intensity (Im) and volumes (V) of the 50 largest clusters of each cell–cell contact. Arrows indicate distribution means. N = 1; (Latr) n = 7; and (Jasp) n = 5. (Scale bar: 5 μm.) (E) Cell–cell contact size (Ac) of control doublets and doublets exposed to Jasp or Latr as a function of contact time. Dotted lines connect contact formation (0 min) with the first time point when data were collected. The shadowed area denotes SD with (Ctrl) N and n as in Fig. 1C. (Jasp) N = 4, n = (3 min: 6, 6 min: 6, 9 min: 16, 12 min: 16, 15 min: 16, 18 min: 16); (Latr) N = 4, n = (3 min: 21, 6 min: 21, 9 min: 21, 12 min: 21, 15 min: 21, 18 min: 9). If not stated otherwise, N corresponds to the number of experiments, and n corresponds to the number of cell doublets.