
|
Fig. 1
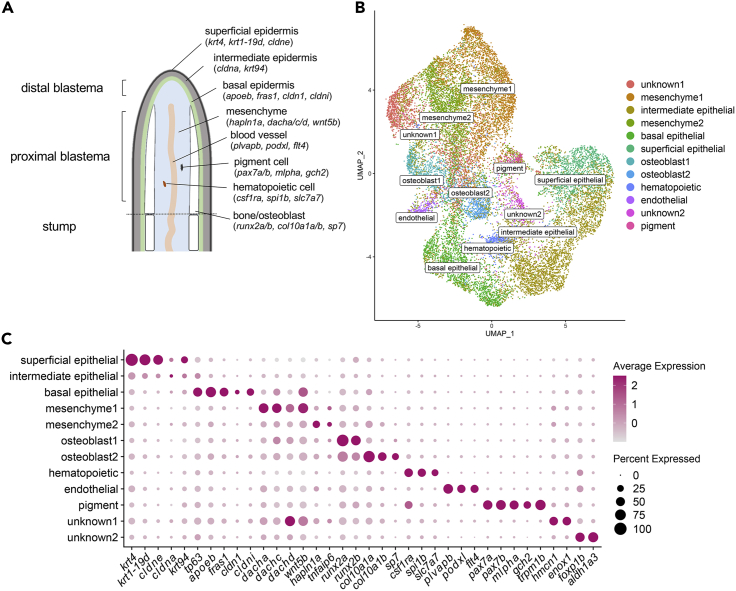
Molecular profiling of fin regeneration reveals distinct cell types including two osteoblast populations
(A) Schematic of zebrafish fin regeneration showing tissues and corresponding gene markers.
(B) UMAP plot visualizing 19,603 cells from sci-RNA-seq analysis of regenerated fins at 3 and 5 dpa. Of the 12 distinct clusters, 10 tissue types could be identified by molecular markers, including two osteoblast populations.
(C) Dotplot visualizing expression of genes demarcating the 12 cell clusters. Circle size represents the percentage of cells expressing the gene, and color indicates average gene expression. See also Figure S1