
|
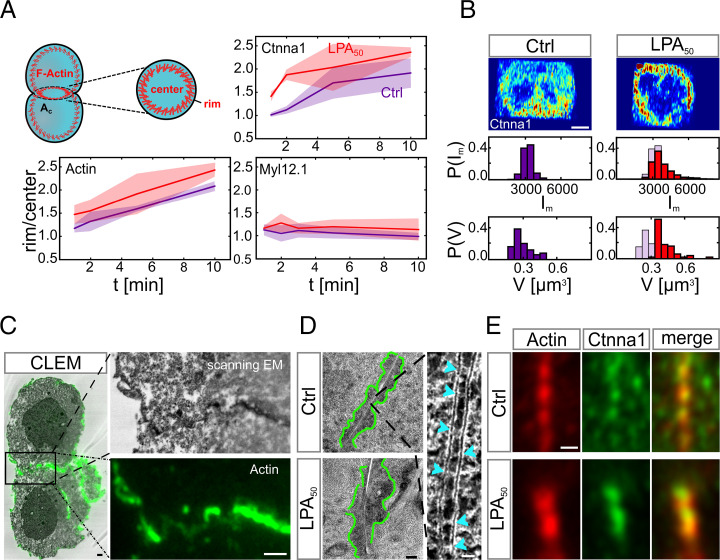
Fig. 2
Cortical tension triggers Ctnna1/F-actin clustering at the contact of cell doublets. (A) Rim to center intensity ratios of core components of the cadherin adhesion complex in doublets. The schematic in Left shows the rim and center regions of the cell–cell contact where the fluorescence mean intensities were measured in control doublets (red line) and doublets exposed to LPA 50 nM (blue line). Doublets were fixed and analyzed for each time point separately (1-, 2-, 5-, and 10-min contact time). F-actin was visualized by Phalloidin with n = 3; (Ctrl) n = 5, 3, 3, and 3 (corresponding to the different contact times mentioned above); and (LPA) n = 6, 5, 4, and 5. Ctnna1 was visualized by immunohistochemistry with n = 3; (Ctrl) n = 5, 3, 5, and 5; and (LPA) n = 4, 3, 4, and 3. Myosin II was visualized by Myl12.1-eGFP expression with n = 1; (Ctrl) n = 9, 8, 7, and 8; and (LPA) n = 5, 5, 4, and 2. Shadowed areas denote SD. (B) Exemplary subdiffraction limited confocal images of Ctnna1 subcellular distribution at the cell–cell contact of control doublets (Left) and doublets exposed to 50 nM LPA (Right). Quantifications below show cluster mean intensity (Im) and volumes (V) of the 50 largest clusters of each cell–cell contact. Blue shadows in Right denote control conditions. (Ctrl) N = 1 and n = 3; (LPA) N = 1 and n = 5. (Scale bar: 5 μm.) (C) CLEM images with F-actin visualized by phalloidin–Alexa-488 (green). Right shows zoomed-in images of the boxed region in Left. (Scale bars: 1 μm.) (D, Left) Electron microscopy (EM) images of electron-dense clusters (outlined with green) at cell–cell contacts in control doublets (Upper) and doublets exposed to 50 nM LPA (Lower). (Scale bar: 200 nm.) D, Right is a zoomed-in image of cadherin-like clusters with individual clusters depicted by light blue arrowheads. (Scale bar: 20 nm.) (E) Representative Airy Scan images of F-actin (red) and Ctnna1 (green) colocalizing in clusters at the cell–cell contact of control doublets (Upper) and doublets exposed to 50 nM LPA (Lower). Cell doublets were fixed after 30-min contact time and visualized by Phalloidin (F-actin) and immunohistochemistry (Ctnna1). If not stated otherwise, N corresponds to the number of experiments, and n corresponds to the number of cell doublets. (Scale bar: 2 μm.)