
Image
|
Figure Caption
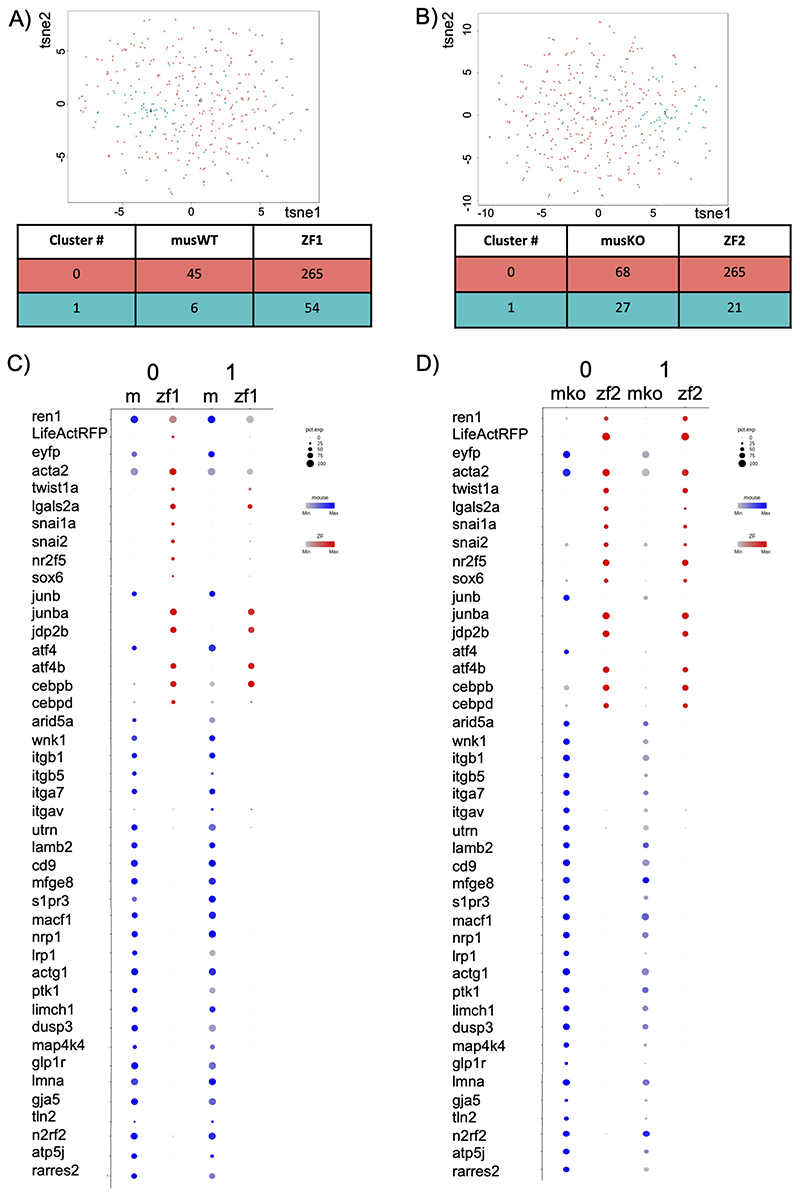
Fig. 3
Merged expression matrices from A) wild-type mouse and zebrafish JG cells and B) renin knockout mouse and zebrafish renin lineage cells following CCA analysis (resolution 0.5 and 0.6 respectively). Associated tables give contributing cell numbers from respective matrices; C) and D) genes differentially expressed between respective mouse and zebrafish libraries, irrespective of genotype, are shown in dot plots.
Acknowledgments
This image is the copyrighted work of the attributed author or publisher, and
ZFIN has permission only to display this image to its users.
Additional permissions should be obtained from the applicable author or publisher of the image.
Full text @ Hypertension