
|
Figure 1
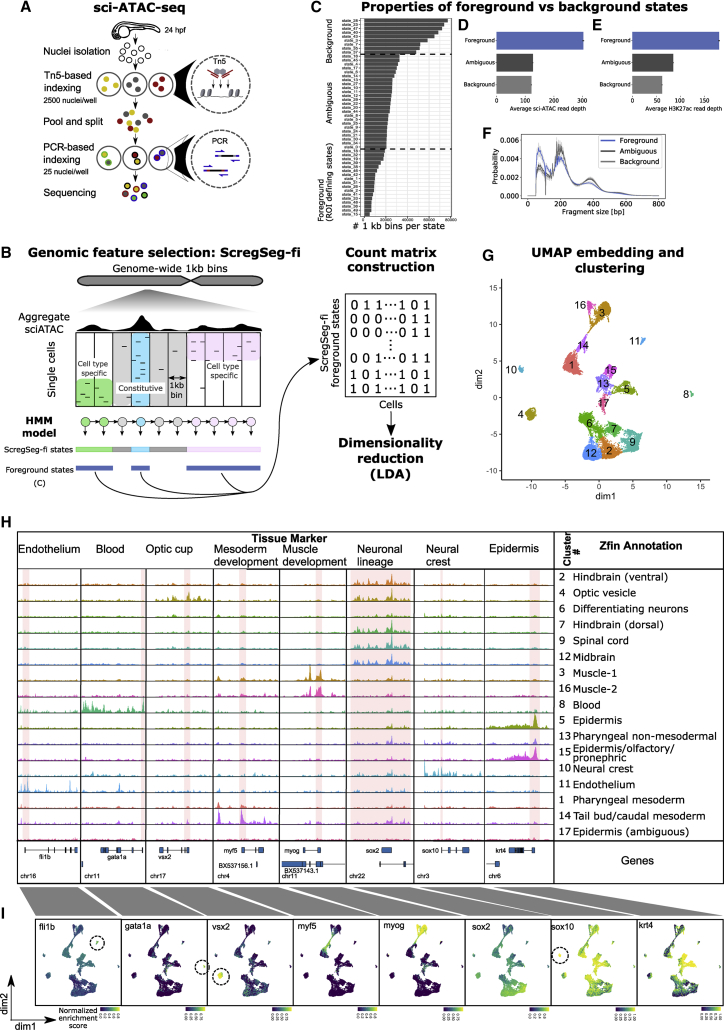
Generating cell-type-specific accessibility profiles from 24-hpf zebrafish embryos
(A) Schematic of sci-ATAC-seq method. Nuclei are extracted from flash-frozen whole embryos staged at 24 hpf. Nuclei are sorted into 96-well plates, 2,500 per well, and barcoded during tagmentation. Tagmented nuclei are pooled and then split into 96-well plates, 25 per well, and a second set of barcodes introduced by PCR. The resulting DNA fragments are pooled and sequenced, with unique barcode combinations representing single cells.
(B) Schematic representation of ScregSeg for genomic feature identification (ScregSeg-fi). The genome is divided into 1-kb bins and segmented using an HMM that assigns a state to each bin based on the accessibility distribution over cells. Subsequently, putative informative (foreground) states are used to define the regions of interest for the dimensionality reduction using latent Dirichlet allocation (LDA).
(C) Number of 1-kb regions per state (state frequency). States with low, medium, or high numbers of assigned genomic regions were grouped into “foreground,” “ambiguous,” and “background.” Foreground states were selected based on the state frequency.
(D) Average number of sci-ATAC-seq reads at 1-kb genomic regions assigned to foreground, ambiguous, and background states. Error bars indicate the 95% confidence intervals around the mean (as determined by seaborn.barplot).
(E) Average number of bulk H3K27sc ChIP-seq reads at 1-kb genomic regions assigned to foreground, background, or ambiguous states. Error bars indicate the 95% confidence intervals around the mean (as determined by seaborn.barplot).
(F) Normalized fragment size distribution of 1-kb genomic regions assigned to foreground, ambiguous, and background states. Ribbons represent 95% confidence intervals around the mean (as determined by seaborn.lineplot).
(G) UMAP representation of the dimensionality-reduced and batch-corrected feature matrix (cell-Topic matrix) on ∼23,000 cells. Colors represent the 17 clusters determined by density clustering.
(H) Summary pseudo-bulk chromatin accessibility profiles from aggregated cells for each density cluster at marker genes of major tissues and cell types of 24-hpf zebrafish embryos. Consensus annotations derived from enrichment of genes that map to differentially accessible segments per cluster, with ZFIN anatomical database terms and published cell-type markers.
(I) Per-cell distribution of accessibility at regions covering the promoters of marker genes, represented in UMAP space. Color represents the rank-based AUCell enrichment score for a given region.