
|
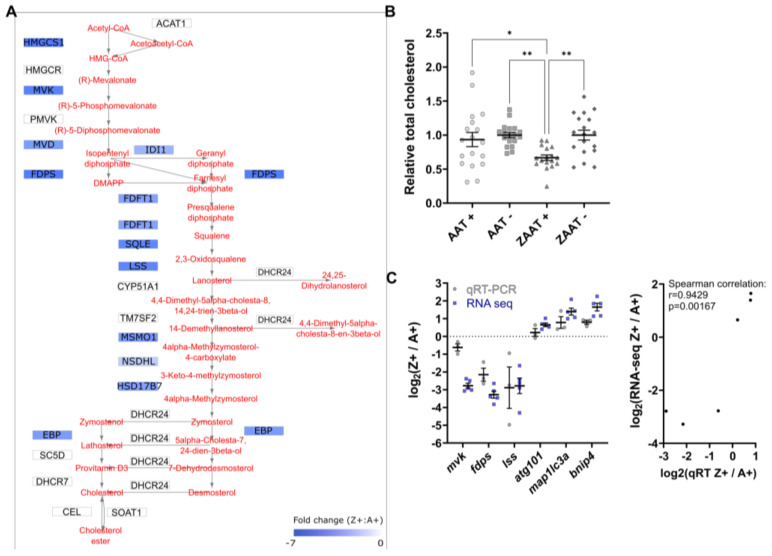
Figure 4
Cholesterol biosynthesis is suppressed in ZAAT-expressing zebrafish liver. (A) Mapping of DEGs onto KEGG pathways suggests downregulation of cholesterol biosynthesis (modified from pathways hsa00900 and hsa00100). (B) Total cholesterol was measured in adult zebrafish livers. A total of 18 fish from each genotype, pooled from 5 independent experiments, were used for analysis. Every single point represents the average of two technical replicate measurements for each animal. One-way ANOVA was used to determine statistical significance. Error bars indicate mean ± s.e.m. * p < 0.05, ** p < 0.01. (C) Validation of RNA-seq by qPCR. Expression profiles of six DEGs from RNA-seq and qPCR data were compared (left panel). qPCR expression values were normalised to the housekeeping genes rpl13a and lsm12b. Correlation analysis of RNA-seq and qPCR (right panel), Spearman’s rho, rs = 0.9429, p = 0.00167.