IMAGE

Fig. 6

ID
ZDB-IMAGE-230211-28
Source
Figures for Zhang et al., 2023
Image
Figure Caption

Fig. 6

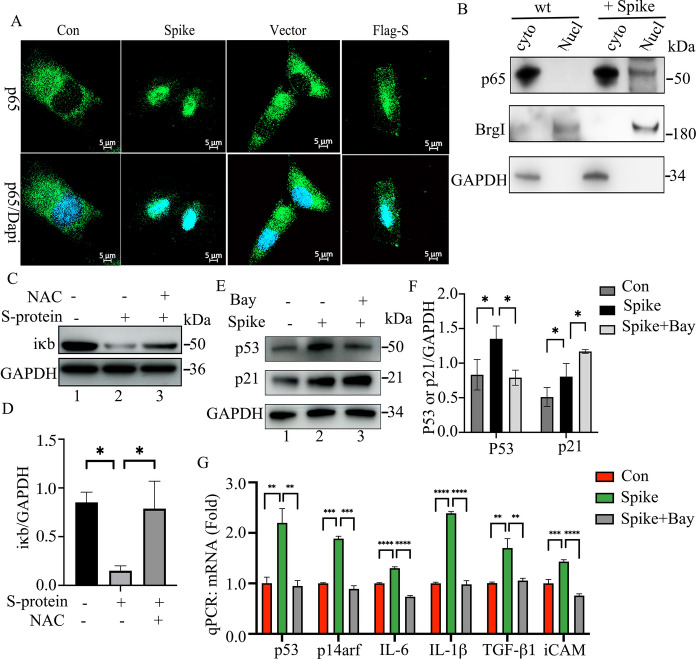
S-protein activates NF-κB pathways in ARPE-19 cells. A Immunofluorescence staining of p65 protein in S-protein-treated or Flag-S-overexpressed ARPE-19 cells. The nuclei were stained with DAPI. The scale bar represents 20 μm. B Cytosol-Nucleus fraction assay to determine the localization of p65 in ARPE-19 cells that were treated with PBS (Con) or S-protein for 48 h. BrgI and GAPDH were used as nuclear and cytosolic markers respectively. C Immunoblot of iκb and GAPDH in ARPE-19 cells that were treated with sham, S-protein and S-protein + NAC respectively. D Densitometry quantitation of iκb vs GAPDH in C. The data represent mean ± SD (n = 3), *p < 0.05. E Immunoblot of the expression of p53, p21 and GAPDH in ARPE-19 cells that were treated with sham, S-protein and S-protein + Bay-11–7082 (NF-κB inhibitor) for 24 h. F Densitometry quantitation of P53 and p21 in E. The P53 and P21 protein level was normalized to GAPDH. The data represent mean ± SD (n = 3), *p < 0.05. G qPCR measuring the expression of p53, p14arf, IL-1β, IL-6, TGF-β1 and iCAM in ARPE-19 cells treated in E. The data represent mean ± SD (n = 3), **p < 0.01, ***p < 0.001

Acknowledgments
This image is the copyrighted work of the attributed author or publisher, and ZFIN has permission only to display this image to its users. Additional permissions should be obtained from the applicable author or publisher of the image. Full text @ Biogerontology