IMAGE

Fig. 1

ID
ZDB-IMAGE-230211-22
Source
Figures for Zhang et al., 2023
Image
Figure Caption

Fig. 1

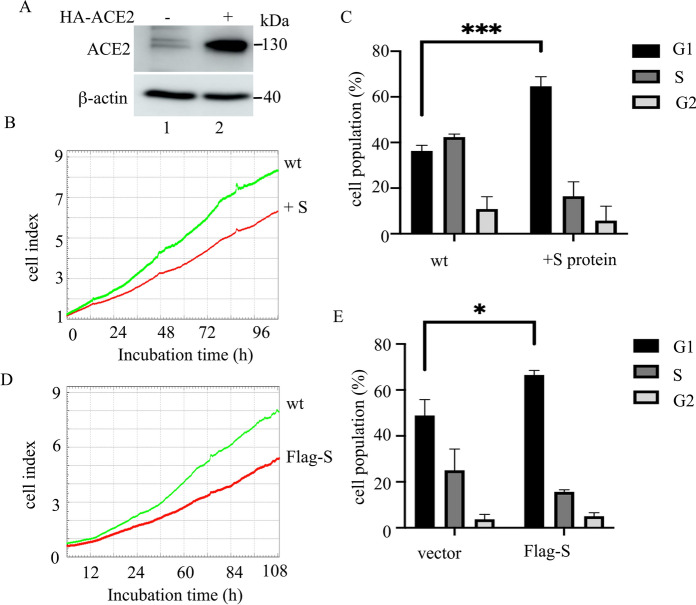
SARS-CoV-2 S-protein inhibits ARPE-19 cell proliferation in vitro. A Immunoblot of ACE2 and β-actin in ARPE-19 or HA-ACE2-overexpressed ARPE-19 cells. B Real-time cell analyzer (RTCA) detection of cell proliferation of ARPE-19 cells (wt), S-protein-treated ARPE-19 cells (B), or Flag-S overexpressed ARPE-19 cells (D). C and E Flow cytometry measurement of the cell cycle of ARPE-19 cells (wt), S-protein-treated ARPE-19 cells (+ S-protein), or Flag-S-overexpressed ARPE-19 cells (Flag-S). The black, gray and blank rectangles represent G1, S, and G2 phases respectively. The data represent mean ± SD, n = 3. Unpaired Student’s T-test was used for statistical analysis. *p < 0.05

Acknowledgments
This image is the copyrighted work of the attributed author or publisher, and ZFIN has permission only to display this image to its users. Additional permissions should be obtained from the applicable author or publisher of the image. Full text @ Biogerontology