
|
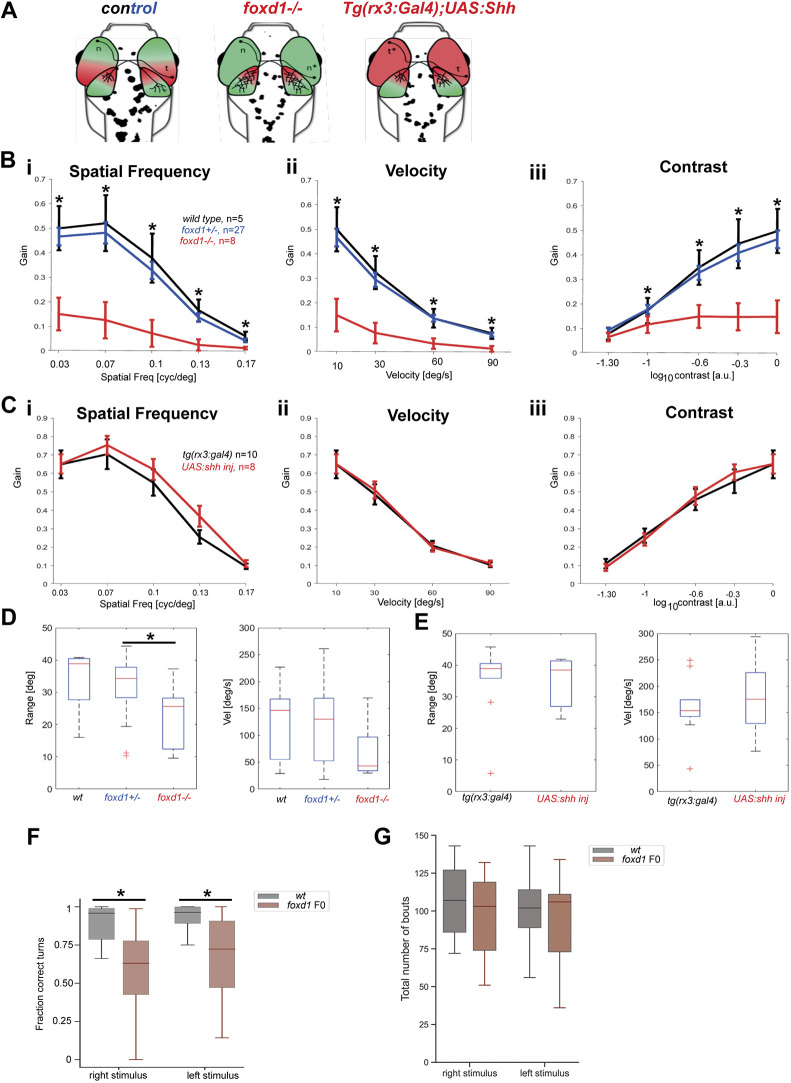
Fig. 3. Optokinetic response assays reveal severe visual deficiencies in foxd1−/− but not tg{rx3:Gal4};UAS:Shh embryos. (A) Diagrammatic representation of the changes in naso-temporal pattern and retinotectal projections observed in the four categories of fish tested by optokinetic response (OKR). Genotype is provided at the top of each diagram. (B,C) Graphs detailing eye gain (expressed in a 0-1 range) in response to changes in spatial frequency (expressed in cycles per screen; Bi,Ci), grating velocity (expressed in degrees per second; Bii,Cii) and contrast (expressed in a 0-1 range; Biii,Ciii) in wild type (black, n=5 in B), foxd1+/− (blue, n=27 in B), foxd1−/− (red, n=8; in B), tg{rx3:Gal4} [black (rx3:gal4), n=10 in C] and tg{rx3:Gal4};UAS:Shh [red, (+UAS:shh), n=8 in C]. Graphical representation was generated using GraphPad Prism5 (data were analysed using two-way ANOVA; *P<0.001). (D,E) Range (expressed in degrees) of slow phase eye movement (left graphs) and peak velocity (expressed in degrees per second) during fast phase eye movement (right graphs) in foxd1−/− versus wild-type and foxd1+/− fish (D), and tg{rx3:Gal4} versus tg{rx3:Gal4};UAS:Shh fish (E) (*P<0.05; one-way ANOVA). (F) Fraction of correct turns for wild-type larvae (n=21) and foxd1 crispants (foxd1 F0, n=21) when subjected to left- and right-oriented whole-field motion stimuli. Only directional bouts (i.e. left- and rightward swims, without forward swims) were considered for quantification. (G) Total number of bouts for wild-type larvae (n=21) and foxd1 crispants (foxd1 F0, n=21) when subjected to left- and right-oriented whole-field motion stimuli.