
|
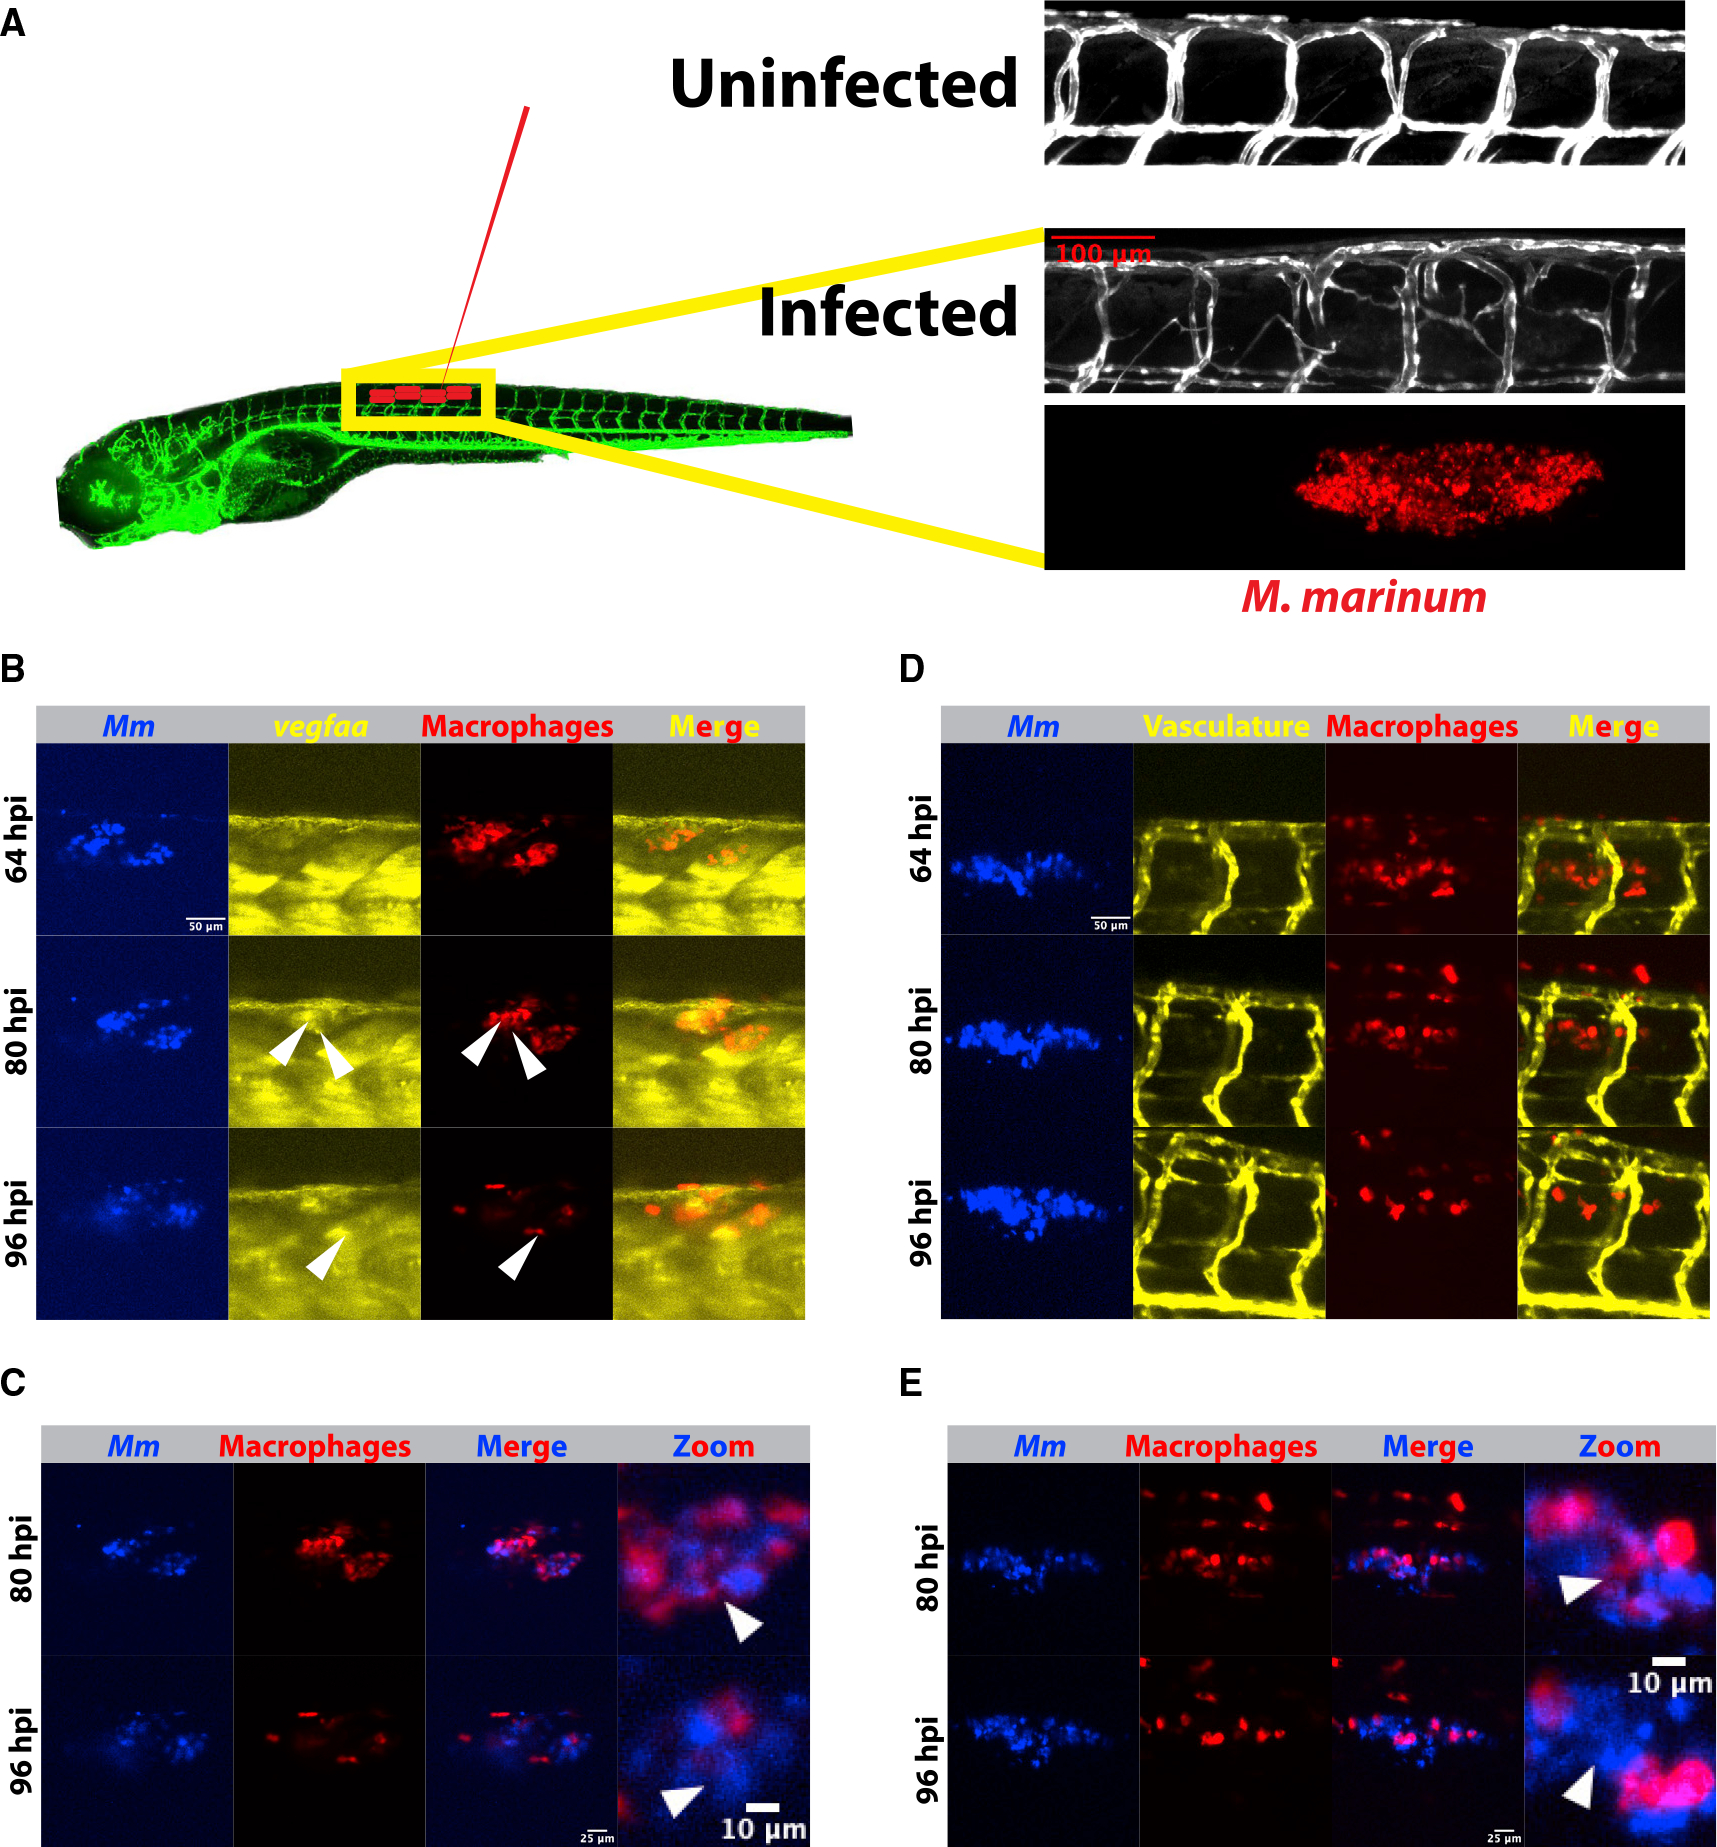
Figure 1. (A) Schematic depicting Tg(kdrl:eGFPs843) zebrafish and the approximate injection site, where ∼50–150 fluorescent Mycobacterium marinum are injected. Inset above displays a confocal image from the trunk region of a kdrl:eGFP zebrafish larva and the highly stereotyped intersomitic vascular patterning. Below, an image from an infected 4 days post infection (dpi) larval zebrafish showing the aberrant vasculature that develops over the course of infection and is the subject of the later quantitation. Also shown is the bacterial channel, demonstrating that this angiogenesis occurs at the site of infection.
(B) Time lapse of larval Tg(irg1:tdTomatoxt40); TgBAC(vegfaa:eGFPpd260) zebrafish infected with 50–150 Mm-eBFP2 (blue) showing an increase in vegfaa reporter (yellow) levels in macrophages (red) over 96 h of imaging. Arrowheads indicate macrophages positive for vegfaa:egfp expression. Scale bar, 50 μm. Representative of 32 fish from one experimental replicate. Stills from Video S1.
(C) Overlay of macrophage and bacterial fluorescence channels from (B) shows a general increase in the extracellular bacterial growth beginning approximately 80 h post infection, correlating with the increasing vegfaa signal in (B). Scale bars, 25 μm and 10 μm (in cropped images). Arrowheads indicate examples of intracellular bacteria at 80 hpi and then extracellular bacteria at the same approximate location at 96 hpi.
(D) Time-lapse imaging of zebrafish vasculature and macrophages using the transgenic line irg1:tdTomato; kdrl:eGFP. Angiogenesis accelerates as extracellular bacteria accumulate, but at a relative delay from induction of the vegfaa:eGFP reporter (64–80 hpi versus 80–96 hpi), suggesting that vegfaa transcription precedes the angiogenic response. Representative of 32 fish from one experimental replicate. Scale bar, 50 μm. Stills from Video S2.
(E) Overlay of the macrophage and bacterial fluorescence channels showing increasing extracellular growth, with the highest degree of angiogenesis at time points with the largest number of extracellular bacteria (D). Scale bars, 25 μm and 10 μm (in cropped images).