
|
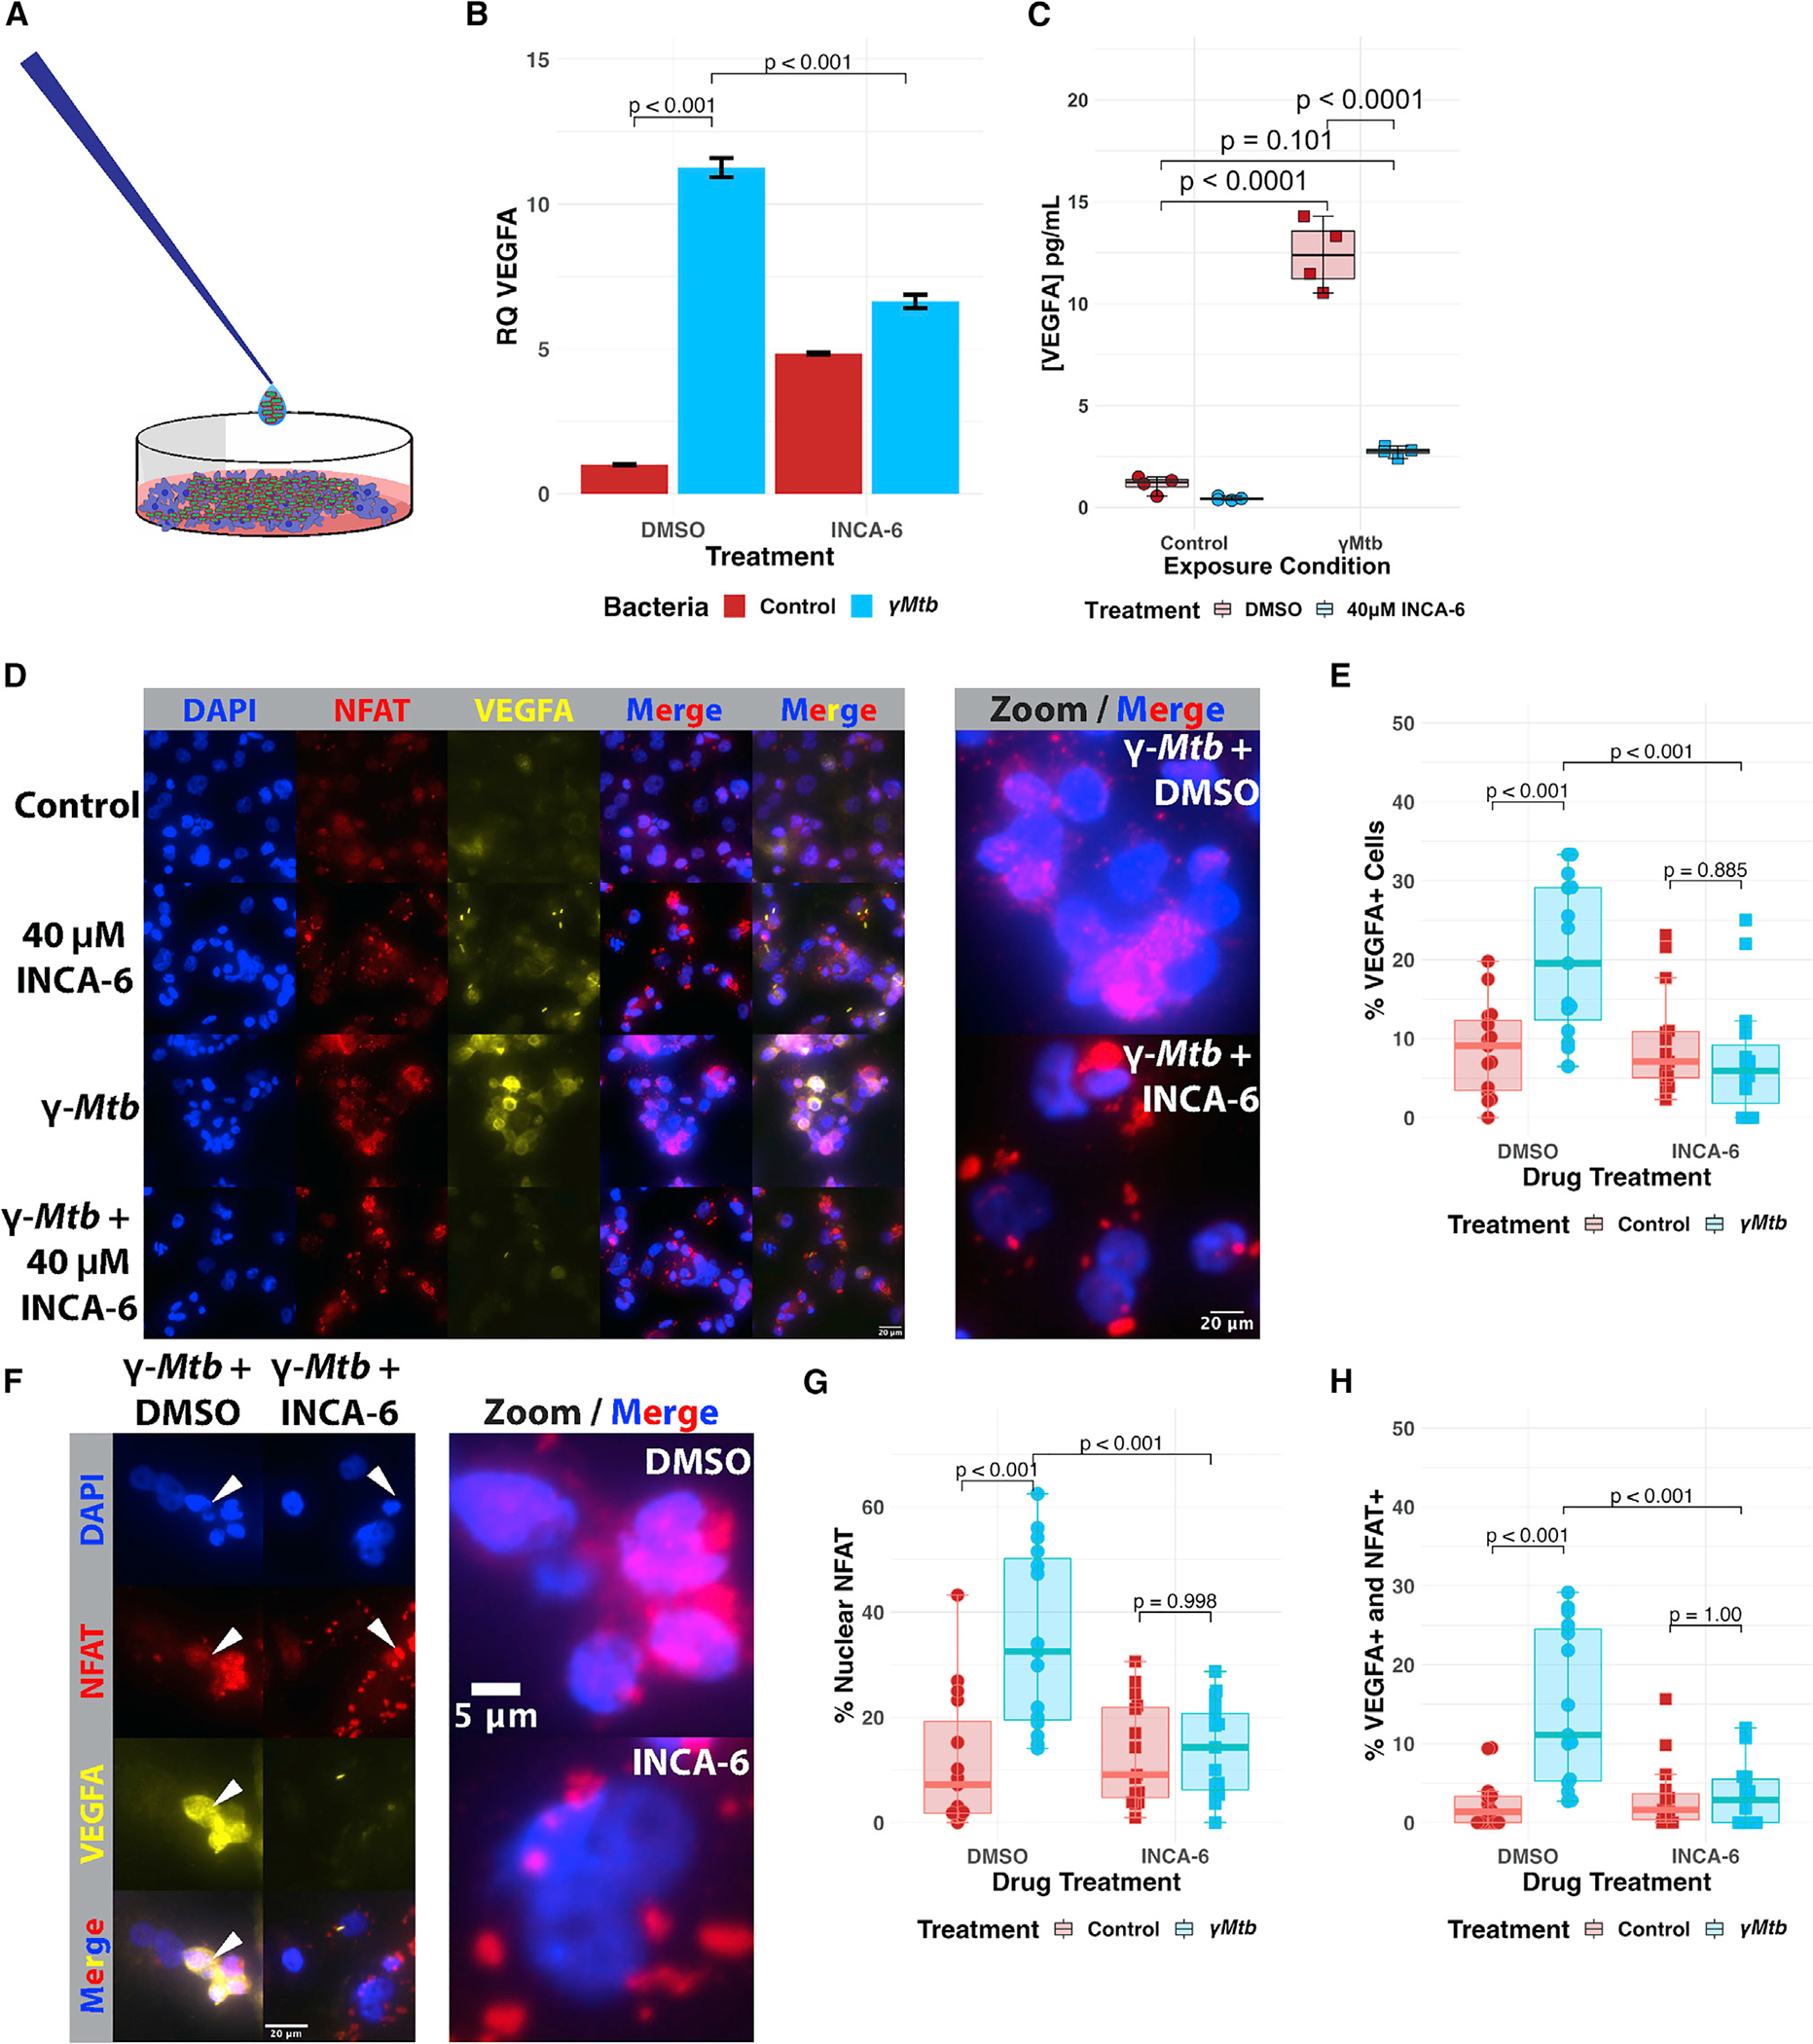
Figure 6. Pharmacological inhibition of NFAT in THP-1 human macrophages restricts VEGFA transcriptional induction and VEGFA production in response to Mtb
(A) Pictorial representation of the γ-irradiated Mycobacterium tuberculosis (γMtb) exposure assay. Partially sonicated clumps of γMtb are overlaid on THP-1 monolayers to model a primarily extracellular route of exposure that might be seen during longer courses of infection, such as in the granuloma.
(B) qRT-PCR analysis of γMtb-exposed THP-1 macrophages at 8 h post exposure. VEGFA transcripts are upregulated in response to γMtb/DMSO-treated cells, but this upregulation is suppressed by treatment with 40 μM INCA-6, a chemical inhibitor that interferes with calcineurin binding to NFAT. Each data point represents the mean relative quantity from three technical replicates for each biological replicate within the single experiment; representative of three independent experimental replicates. Additional replicates are provided in Figures S4A and S4B. Statistics from ANOVA with Tukey post-hoc honest significant differences test.
(C) Supernatant ELISA of THP-1 macrophages at 24 h post exposure reveals potent induction of VEGFA only in the γMtb/DMSO-treated group. Representative of three independent experiments. Statistics from ANOVA with Tukey post-hoc honest significant differences test.
(D) Immunofluorescence imaging reveals upregulation of VEGFA in γMtb-exposed THP-1 cells and substantial NFATC2 upregulation and nuclear translocation after treatment. Effects are both inhibited by treatment with INCA-6. DAPI channel labels nuclei; NFAT is detected by staining with anti-NFATC2 antibody; VEGFA detected by staining with anti-VEGFA antibody. Representative of three independent biological replicates.
(E) Quantitation of the percentage of VEGFA+ cells within entire images for (D). The first five images from each experimental group were selected and computationally blinded. Total cell number was counted in addition to the number of VEGFA+ cells in each field. Each data point represents the percentage of VEGFA+ cells in the field; 15 (5 of each of 3 total replicates) total fields were counted for each groups (5 from each of 3 independent experiments). Total number of cells counted = 5,264. Statistics from ANOVA with Tukey honest significant differences test.
(F) Magnified immunofluorescence images demonstrating VEGFA inhibition by addition of INCA-6 with γMtb-exposed THP-1 cells. Note the white arrows showing nuclear localization of NFATC2 corresponding with VEGFA signal in the DMSO-treated condition while NFATC2 nuclear localization is disrupted in the INCA-6 condition and little VEGFA can be observed.
(G) Quantitation of the percentage of cells with nuclear NFAT residence from the same images as (F). Each data point represents the percentage of NFAT nuclear-resident cells in the field; 15 total fields were counted for each groups (5 from each of 3 independent experiments). Total number of cells counted = 5,264. Statistics from ANOVA with Tukey honest significant differences test.
(H) Quantitation from (F and G) of the percentage of total cells with nuclear NFAT residence and also expressing VEGFA out of the total number of cells. Each point represents one of 15 total fields counted for each group (5 from each of 3 independent experiments). Total number of cells counted = 5,264. Statistics from ANOVA with Tukey honest significant differences test.