
Image
|
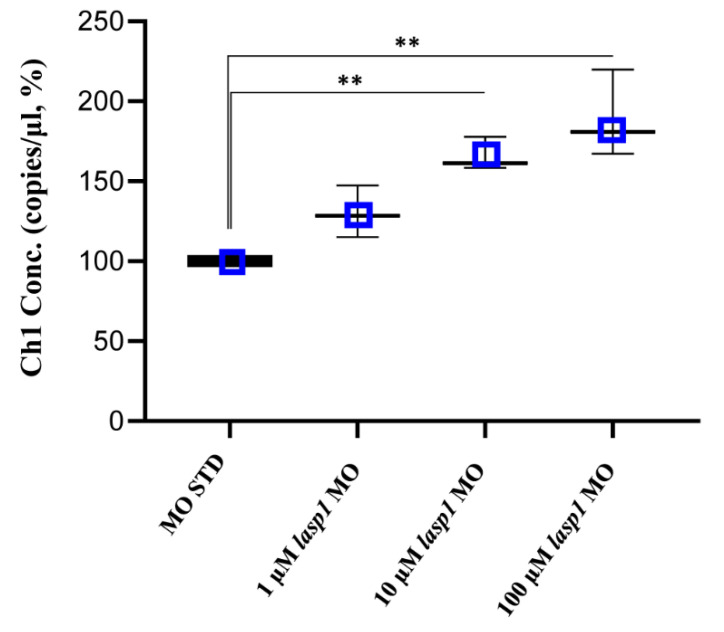
Figure Caption
Figure 5
Absolute quantifications of lasp1 mRNA in lasp1 MO morphants using ddPCR. Dose-dependent increases in lasp1 mRNA levels were observed. The graph represents the average values of copies/μL referred to the MO STD samples; error bars are SDs. ** p < 0.01 in one-way ANOVA followed by Bonferroni testing.
Acknowledgments
This image is the copyrighted work of the attributed author or publisher, and
ZFIN has permission only to display this image to its users.
Additional permissions should be obtained from the applicable author or publisher of the image.
Full text @ Genes (Basel)