IMAGE

Fig. 2.

ID
ZDB-IMAGE-230119-38
Source
Figures for Wang et al., 2022
Image
Figure Caption

Fig. 2.

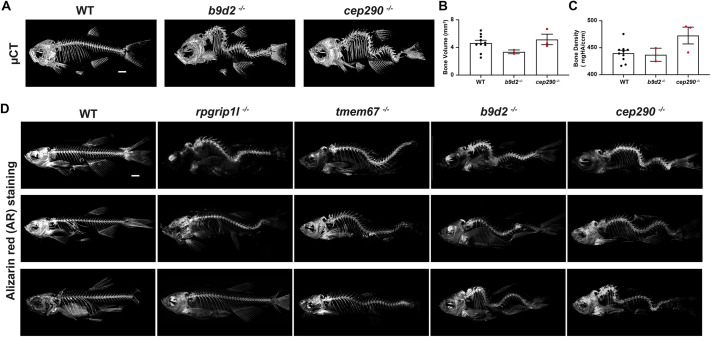
Scoliosis in transition zone (TZ) mutants. (A) Microcomputed tomography (μCT) images of lateral views of representative WT, and b9d2 and cep290 mutant zebrafish at 3 mpf. (B,C) The bone volume (B) and density (C) of WT, and b9d2 and cep290 mutant zebrafish. Each dot represents individual adults. WT, black dots; b9d2−/− and cep290−/−, red dots. WT (n=10), b9d2−/− (n=2) and cep290−/− (n=3). Error bars represent ±s.e.m. (D) Alizarin Red (AR)-stained lateral view images of representative WT, and rpgrip1l, tmem67, b9d2 and cep290 mutant zebrafish at 3 mpf. Scale bars: 1000 μm.

Figure Data
Acknowledgments
This image is the copyrighted work of the attributed author or publisher, and ZFIN has permission only to display this image to its users. Additional permissions should be obtained from the applicable author or publisher of the image. Full text @ Dis. Model. Mech.