
|
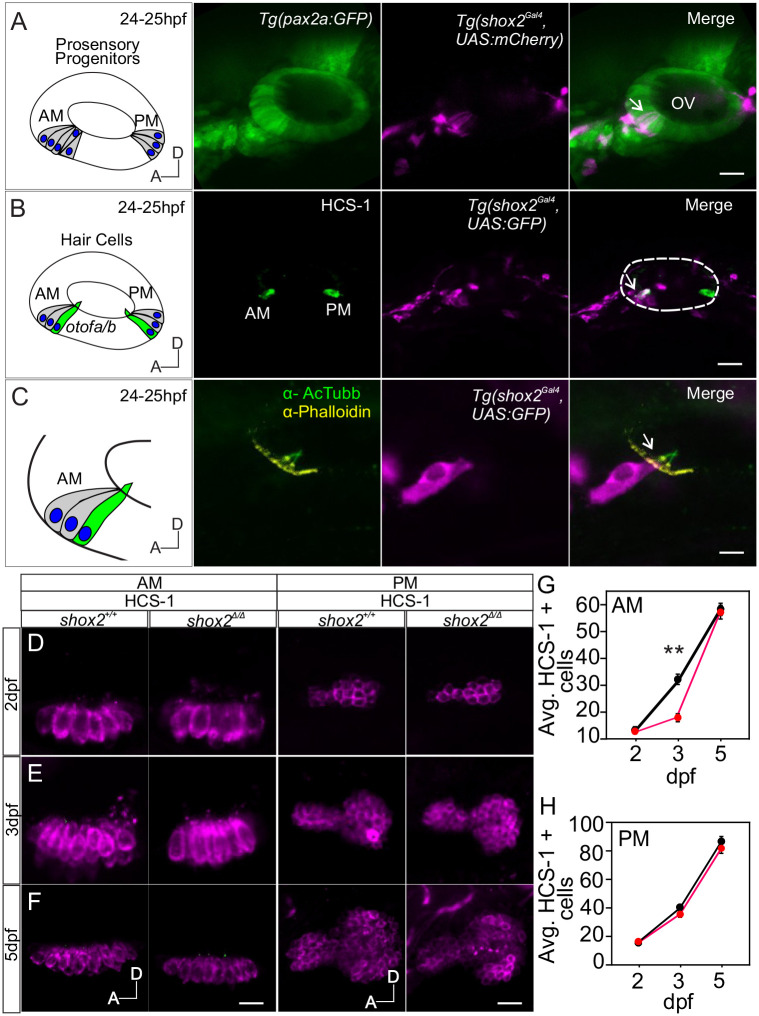
Fig. 5. Comparing number of hair cells between shox2+/+ and shox2Δ/Δ animals. (A) Diagram depicting the developing sensory domain (gray) in the inner ear at 24-25 hpf with developing hair cells expressing otoferlin a and b (otof a/b) in the anterior macula (AM) and posterior macula (PM). Fluorescent images of Tg (shox2Gal4, UAS:mCherry) reporter with HCS1 antibody immunofluorescence labeling at 24-25 hpf. The HCS-1 antibody recognizes Otoferlin. The merged image depicts shox2 reporter labeled cells (arrows) within the OV (otic vesicle) in the anteroventral region (n=9 embryos). Dashed lines mark the otic vesicle. Whole-mount HCS-1 immunolabeling of hair cells from the AM and PM in shox2+/+ and shox2Δ/Δ larvae at (B) 2, (C) 3 and (D) 5 dpf were acquired for quantification. (E) HCS-1 cell counts from the AM are as follows: 2 dpf, shox2+/+ (12.9±0.8 cells, n=18 larvae), shox2Δ/Δ (12.8±1.0 cells, n=18 larvae), 3 dpf, shox2+/+ (28.3±1.6 cells, n=12 larvae), shox2Δ/Δ (20.7±1.5 cells, n=13 larvae), 5 dpf, shox2+/+ (57.2±1.8 cells, n=16 larvae), shox2Δ/Δ (55.2±1.8 cells, n=15 larvae). (F) HCS-1 cell counts from the PM are as follows: 2 dpf, shox2+/+ (18.7±1.3 cells, n=13 larvae), shox2Δ/Δ (18.9±1.0 cells, n=13 larvae), 3 dpf, shox2+/+ (41.6±1.2 cells, n=12 larvae), shox2Δ/Δ (37.3±2.1 cells, n=12 larvae), 5 dpf, shox2+/+ (87.1±3.2 cells, n=19), shox2Δ/Δ (80.0±2.9 cells, n=20 larvae). One-way ANOVA and Sidak multiple comparison test were used. **P≤0.01. Values reported as mean±s.e.m. Scale bars: 10 µm.