
|
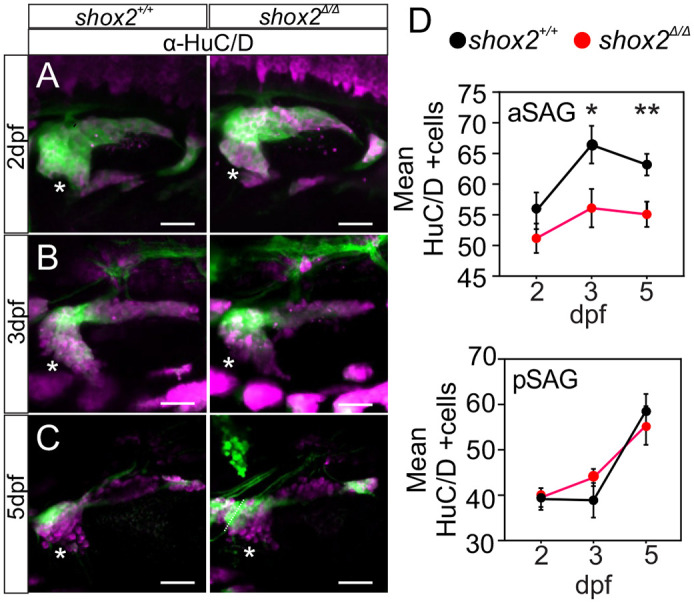
Fig. 4. Comparing number of SAG between shox2+/+ and shox2Δ/Δ animals. HuC/D immunostaining of shox2+/+ and shox2Δ/Δ larvae that contain the Tg(neurod1: EGFP) reporter at (A) 2, (B) 3 and (C) 5 dpf. EGFP (green) and HuC/D (magenta) are shown. Asterisks mark the anterior SAG (aSAG). (D) HuC/D cell counts from aSAG are as follows: 2 dpf, shox2+/+ (55.7±3.0 cells, n=12 larvae), shox2Δ/Δ (51.2±2.4 cells, n=11 larvae), 3 dpf, shox2+/+ (66.4±3.1 cells, n=10 larvae), shox2Δ/Δ (56.1±3.1 cells, n=11 larvae), 5 dpf, shox2+/+ (63.2±1.8 cells, n=11 larvae), shox2Δ/Δ (55.1±2.1 cells, n=12 larvae). (E) HuC/D cell counts from posteromedial SAG (pSAG) are as follows: 2 dpf, shox2+/+ (39.5±1.9 cells, n=15 larvae), shox2Δ/Δ (39.1±1.8 cells, n=14 larvae), 3 dpf, shox2+/+ (38.9±3.8 cells, n=10 larvae), shox2Δ/Δ (43.9±1.9 cells, n=11 larvae), 5 dpf, shox2+/+ (58.6±3.7 cells, n=13 larvae), shox2Δ/Δ (55.4±4.3 cells, n=14 larvae). One-way ANOVA and Sidak multiple comparison test were used. *P≤0.05, **P≤0.01. Values reported as mean±s.e.m. Scale bars: 10 µm.