
|
Fig. 4
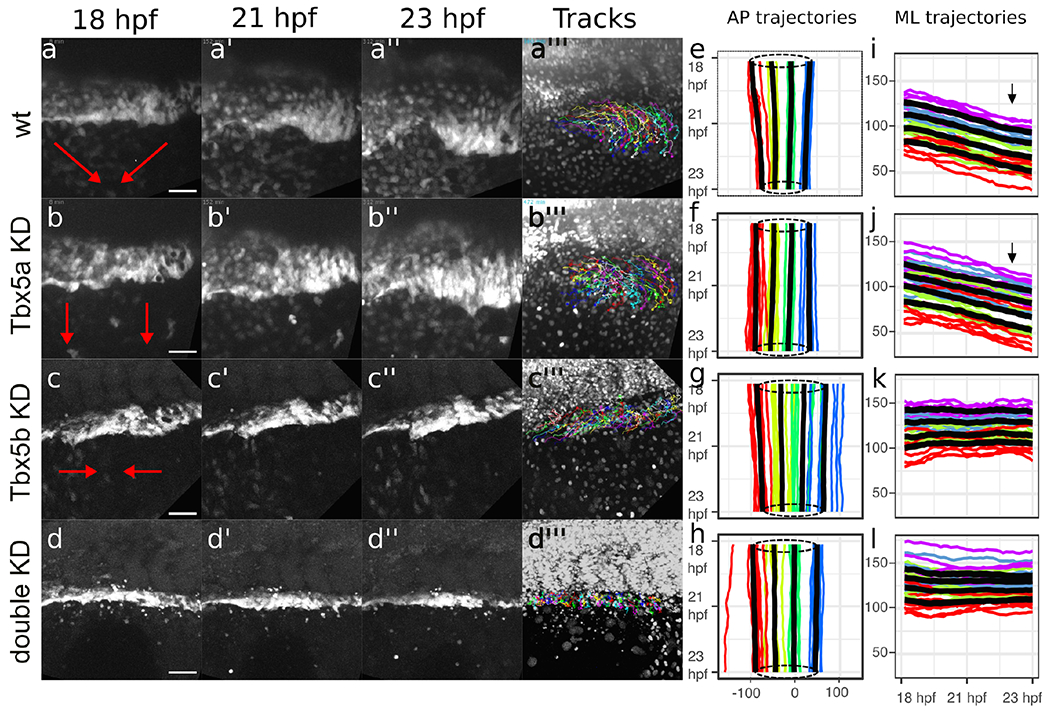
Red arrows depict the general overall movement of the fin field cells. (a-a”’) The cells of the wt fin field both converge along the AP axis and migrate along the ML axis to condense at the site of the limb bud. (b-b”’) Tbx5a knock-down cells migrate laterally but do not converge along the AP axis. (c-c”’) Tbx5b knock-down cells converge along the AP axis but do not migrate laterally. (d-d”’) double-knock-down cells appear to neither migrate laterally nor converge along the AP axis. (a”’, b”’, c”’, d”’) shows the tracks overlaid over the nuclei at the final frame tracked for each respective movie (see supplemental figure for enlargement of these panels). All stills from time-lapse movies show the LPM fin field oriented with anterior to the left and dorsal towards top. (e-h) Spaghetti plots depict the mean AP position of LPM cells adjacent to somite 1-4. Each colored line represents the mean relative AP position of cells for each embryo, shown on x-axis plotted relative to time on the y-axis with red representing cells adjacent to somite 1, yellow representing cells adjacent to somite 2, green representing cells adjacent to somite 3, and blue representing cells adjacent to somite 4. Bold black lines represent composite averages across all embryos from each group. Dotted circles denote average AP extent of limb-field domains at 18 hpf (top) and 23 hpf (bottom) to highlight convergence movements. (i-l) Spaghetti plots show the mean ML position for cells divided into 4 equal quartiles. Each colored line represents the mean ML position for each embryo, with red representing cells in the first quartile, green representing cells in the second quartile, blue representing cells in the third quartile and purple representing cells in the fourth quartile. The black lines represent the mean ML position for cells adjacent to each somite across all embryos for that grouping, with relative positions of cells plotted on the y-axis against time on the x-axis. (e, i) wt. (f, j) Tbx5a knock-downs. (g, k) Tbx5b knock-downs. (h, l) Double Tbx5a/Tbx5b knock-downs. Scale bars=50 μm.
Reprinted from Developmental Biology, 481, Boyle-Anderson, E.A.T, Mao, Q., Ho, R.K., Tbx5a and Tbx5b paralogues act in combination to control separate vectors of migration in the fin field of zebrafish, 201-214, Copyright (2021) with permission from Elsevier. Full text @ Dev. Biol.