
Image
|
Figure Caption
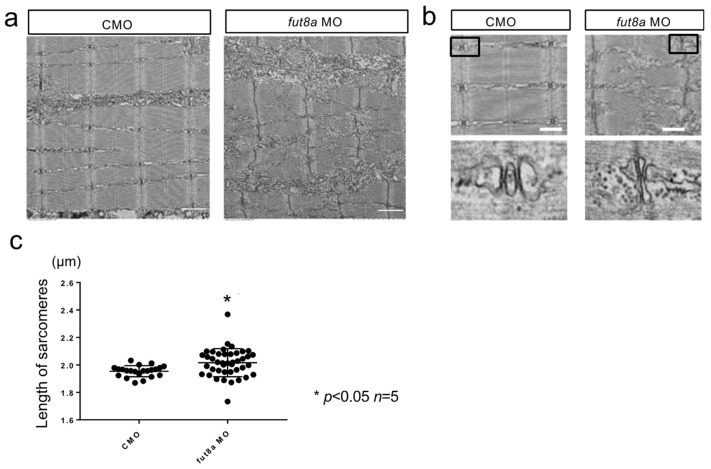
Figure 5 fut8a morphants show abnormalities in sarcomere formation (a) fut8a morphants displayed abnormal sarcomere structure with distorted Z-line and H-bands. Scale bar: 1 μm. (b) The triad of fut8a morphants was disorganized. Black boxes show the location of lower images. Scale bar: 1 μm. (c) Histogram of the variation in sarcomere length. CMO: Median 1.956, Max 2.032, Min 1.869. fut8a MO: Median 2.0325, Max 2.153, Min 1.772 (t-test. p < 0.01, n = 5).
Figure Data
Acknowledgments
This image is the copyrighted work of the attributed author or publisher, and
ZFIN has permission only to display this image to its users.
Additional permissions should be obtained from the applicable author or publisher of the image.
Full text @ Cells