
|
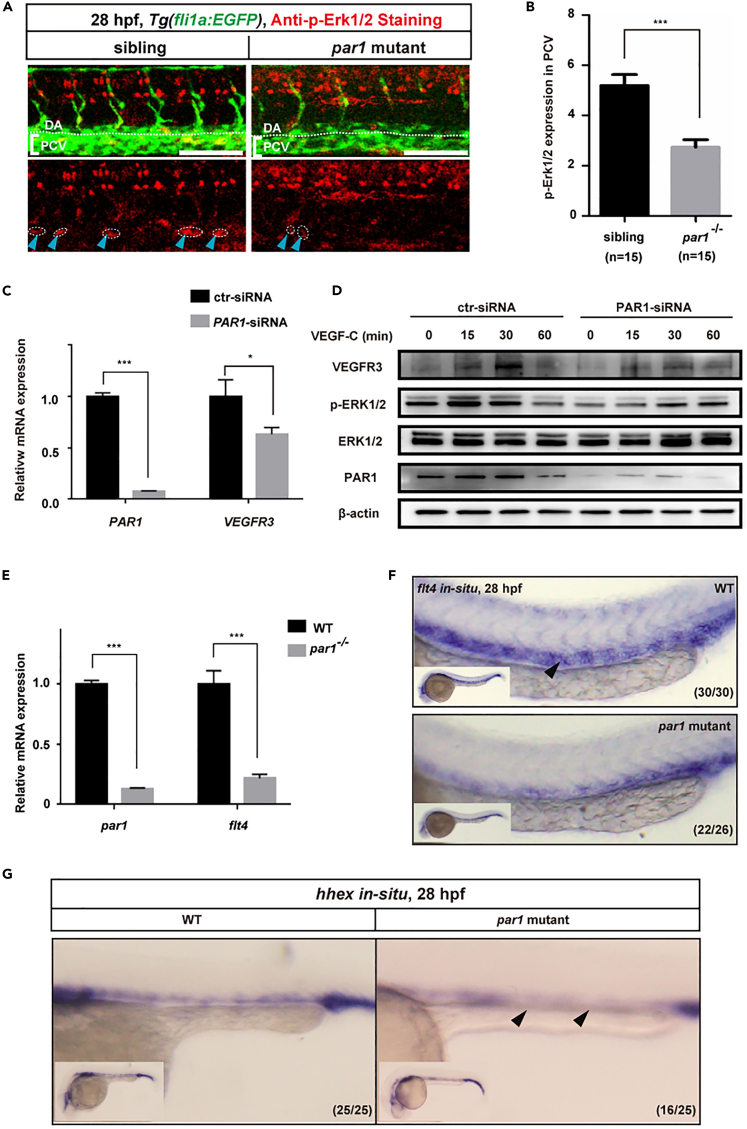
Fig. 7
Loss of par1 function decreases p-Erk1/2 activity and flt4 expression in the PCV of zebrafish embryos
(A) Immunostaining of phosphoErk1/2 (p-Erk1/2) activity in Tg(fli1a:EGFP) siblings and par1 homozygous mutants at 28 hpf. Blue arrowheads with white dashed lines indicate positive p-Erk1/2 staining; DA and PCV (in brackets) area are noted. Scale bars: 100 μm.
(B) Quantification of p-Erk1/2 expression staining in the PCV of siblings (n = 15 embryos) and par1 mutants (n = 15 embryos); 8 somites/embryos were used for quantification.
(C) Relative mRNA expression of VEGFR3 in HDLECs after ctr-siRNA (control) and PAR1-siRNA transfection.
(D) Western blot analysis of p-ERK1/2 activity in HDLECs transfected with ctr-siRNA or PAR1-siRNA, followed by VEGFC treatment.
(E) Relative mRNA expression of the flt4 gene in siblings and par1 homozygous zebrafish embryo mutants.
(F) WISH of flt4 gene expression at 28 hpf in wild-type and par1 homozygous mutant embryos. The white arrowhead indicates the PCV area.
(G) WISH of hhex gene expression at 28 hpf in wild-type and par1 mutant embryos. The white arrowhead indicates the PCV area. In (B, C, and, E), values represent means ± SEMs. ∗p ≤ 0.05, ∗∗p ≤ 0.001, ∗∗∗p ≤ 0.0001 in the Student's t test.