
Image
|
Figure Caption
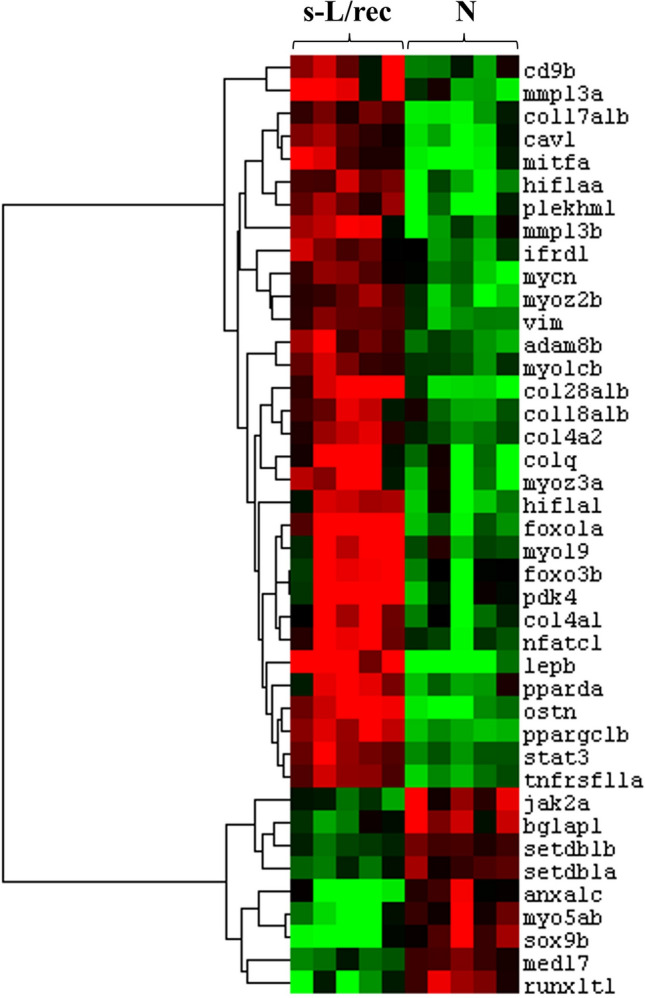
Figure 3
Heat map representing the relative mRNA expression levels of genes differentially expressed (p < 0.01) between normal (N) and recovered (s-L/rec) individuals, involved in bone remodeling and/or muscle regeneration.
Acknowledgments
This image is the copyrighted work of the attributed author or publisher, and
ZFIN has permission only to display this image to its users.
Additional permissions should be obtained from the applicable author or publisher of the image.
Full text @ Sci. Rep.