
Image
|
Figure Caption
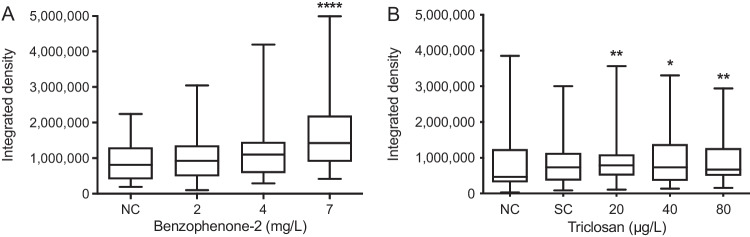
Fig. 2
Integrated density of the thyroid follicles of zebrafish (Danio rerio) embryos after 5 days of exposure to benzophenone-2 (BP-2; A) and triclosan (TCS; B). BP-2: n = 45–47; TCS: n = 40–47. The central line displays the median and the whiskers are showing the standard deviation. Asterisks indicate statistically significant differences of the exposure groups to the negative control (NC) group: *p < 0.05, **p < 0.01; ****p < 0.0001. SC = solvent control
Acknowledgments
This image is the copyrighted work of the attributed author or publisher, and
ZFIN has permission only to display this image to its users.
Additional permissions should be obtained from the applicable author or publisher of the image.
Full text @ Environ. Sci. Pollut. Res. Int.