
Fig. 4
- ID
- ZDB-IMAGE-221214-325
- Publication
- Chen et al., 2021 - Cardioprotective responses to aerobic exercise-induced physiological hypertrophy in zebrafish heart
- All Figures
- Figures for Chen et al., 2021
|
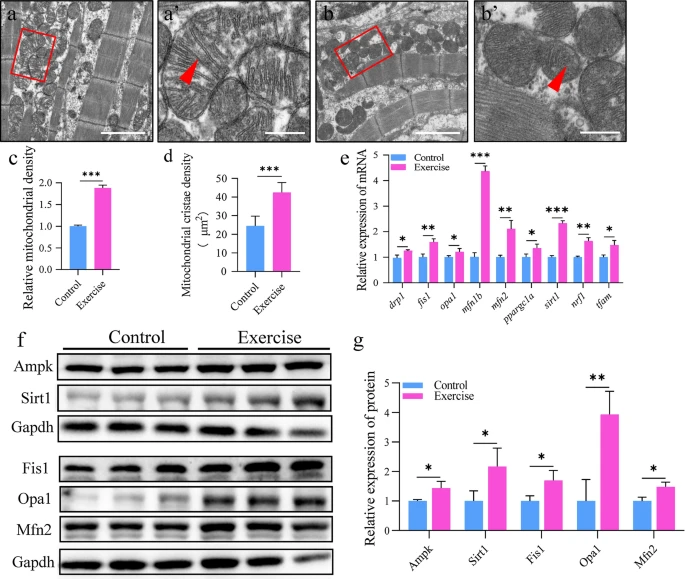
Fig. 4
Aerobic exercise induces dynamic changes in mitochondria morphology. a, b Representative transmission electron micrographs of cardiomyocytes from the control (a) and exercise (b) groups; scale bar = 2 μm. a′, b′ Magnified images of the red boxes in a, b, representing the mitochondria; red triangles point to the mitochondrial cristae; scale bar = 0.4 μm. c Relative mitochondrial density. d Mitochondrial cristae density. e mRNA expression of mitochondrial fission and fusion-related genes in zebrafish heart. f, g Protein expression for fission and fusion in the hearts of zebrafish. Statistical significance was determined using the Student’s t test: ***p < 0.001